
Page 123 - GPD-3-3
P. 123
Gene & Protein in Disease Hydrogen sulfide ameliorates NAFLD
GraphPad Prism 8. Bonferroni was applied to determine 3. Results and discussion
differences between the two groups, whereas a one-way
analysis of variance was used for comparisons among three 3.1. NaHS reduces lipid droplet accumulation in
or more groups. Statistical significance was defined as NAFLD cells
P < 0.05, 0.01, and 0.001, signifying statistically significant To construct an NAFLD model, commercial animal fat was
differences in the result. used with mouse hepatocyte FL83B cells. FL83B cells were
A B C
D E
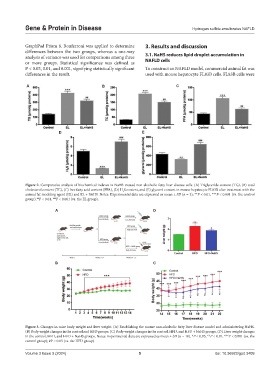
Figure 2. Comparative analysis of biochemical indexes in NaHS-treated non-alcoholic fatty liver disease cells. (A) Triglyceride content (TG), (B) total
cholesterol content (TC), (C) free fatty acid content (FFA), (D) H S content, and (E) glycerol content in mouse hepatocyte FL83B after treatment with the
2
animal fat modeling agent (EL) and EL + NaHS. Notes: Experimental data are expressed as mean ± SD (n = 3); **P < 0.01, ***P < 0.001 (vs. the control
###
group); P < 0.01, P < 0.001 (vs. the EL group).
##
A D
B C
Figure 3. Changes in mice body weight and liver weight. (A) Establishing the mouse non-alcoholic fatty liver disease model and administering NaHS.
(B) Body weight changes in the control and HFD groups. (C) Body weight changes in the control, HFD, and HFD + NaHS groups. (D) Liver weight changes
in the control, HFD, and HFD + NaHS groups. Notes: Experimental data are expressed as mean ± SD (n = 10). *P < 0.05, **P < 0.01, ***P < 0.001 (vs. the
control group); #P < 0.05 (vs. the HFD group).
Volume 3 Issue 3 (2024) 5 doi: 10.36922/gpd.3409