
Page 113 - GPD-4-1
P. 113
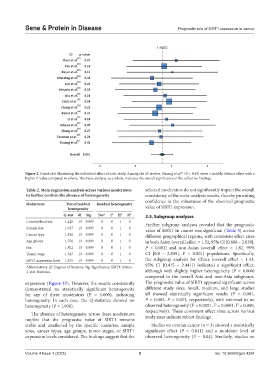
Gene & Protein in Disease                                        Prognostic role of SIRT1 expression in cancer


            Figure 2. Forest plot illustrating the individual effect of each study. Among the 15 studies, Shuang et al.  (P = 0.43) show a notably distinct effect with a
                                                                              11
            higher P-value compared to others. The meta-analysis, as a whole, indicates the overall significance of the collective findings.

            Table 2. Meta‑regression analysis across various moderators   selected moderators do not significantly impact the overall
            to further confirm the absence of heterogeneity    consistency of the meta-analysis results, thereby providing
                                                               confidence in the robustness of the observed prognostic
            Moderators       Test of residual   Residual heterogeneity
                              homogeneity                      value of SIRT1 expression.
                            Q‑stat  df  Sig.  Tau 2  I 2  H 2  R 2  3.3. Subgroup analyses
            Country/location  1.225  13  0.999  0  0  1  0     Further subgroup analyses revealed that the prognostic
            Sample size      1.637  13  0.999  0  0  1  0      value of SIRT1 in cancer was significant (Table 3) across
            Cancer type      1.836  13  0.999  0  0  1  0      different geographical regions, with consistent effect sizes
            Age groups       1.756  13  0.999  0  0  1  0      in both Asian (overall effect = 1.32, 95% CI [0.608 – 2.029],
            Sex              1.852  13  0.999  0  0  1  0      P < 0.001)  and non-Asian  (overall effect =  1.82, 95%
            Tumor stage      1.547  13  0.999  0  0  1  0      CI  [0.8 –  2.839],  P <  0.001)  populations. Specifically,
            SIRT1 expression level  1.475  13  0.999  0  0  1  0  the subgroup analysis for China (overall effect = 1.43,
            Abbreviations: df: Degrees of freedom; Sig: Significance; SIRT1: Sirtuin   95%  CI [0.415  –  2.441])  indicated a  significant  effect,
            1; stat: Statistics.                               although with slightly higher heterogeneity (P = 0.006)
                                                               compared to the overall Asia and non-Asia subgroups.
            expression (Figure 3F). However, the results consistently   The prognostic value of SIRT1 appeared significant across
            demonstrated no statistically significant heterogeneity   different study sizes. Small, medium, and large studies
            for any of these moderators (P  ≈ 1.000), indicating   all showed statistically significant results (P = 0.001,
            homogeneity.  In  each  case,  the  Q-statistics  showed  no   P  = 0.002,  P = 0.021, respectively), with minimal to no
                                                                                             2
                                                                                   2
                                                                                                      2
            heterogeneity (P = 1.000).                         observed heterogeneity (I  = 0.0001, I  = 0.0001, I  = 0.000,
                                                               respectively). These consistent effect sizes across various
              The absence of heterogeneity across these moderators
            implies  that  the  prognostic  value  of  SIRT1  remains   study sizes indicate robust findings.
            stable and unaffected by the specific countries, sample   Studies on ovarian cancer (n = 3) showed a statistically
            sizes, cancer types, age groups, tumor stages, or SIRT1   significant effect (P = 0.041) and a moderate level of
            expression levels considered. The findings suggest that the   observed heterogeneity (I  = 0.04). Similarly, studies on
                                                                                    2

            Volume 4 Issue 1 (2025)                         5                               doi: 10.36922/gpd.4294