
Page 115 - GPD-4-1
P. 115
Gene & Protein in Disease Prognostic role of SIRT1 expression in cancer
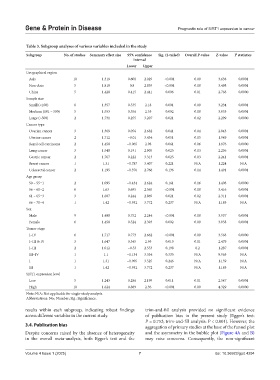
Table 3. Subgroup analyses of various variables included in the study
Subgroup No. of studies Summary effect size 95% confidence Sig. (2‑tailed) Overall P-value Z‑value I statistics
2
interval
Lower Upper
Geographical region
Asia 10 1.319 0.608 2.029 <0.001 0.00 3.638 0.0001
Non-Asia 5 1.819 0.8 2.839 <0.001 0.00 3.498 0.0001
China 5 1.428 0.415 2.441 0.006 0.01 2.763 0.0000
Sample size
Small (<100) 8 1.357 0.535 2.18 0.001 0.00 3.234 0.0001
Medium (101 – 500) 5 1.553 0.556 2.55 0.002 0.00 3.053 0.0001
Large (>500) 2 1.731 0.255 3.207 0.021 0.02 2.299 0.0000
Cancer type
Ovarian cancer 3 1.369 0.056 2.682 0.041 0.04 2.043 0.0001
Uterine cancer 2 1.712 −0.01 3.434 0.051 0.05 1.949 0.0001
Renal cell carcinoma 2 1.458 −0.065 2.98 0.061 0.06 1.876 0.0000
Lung cancer 3 1.548 0.191 2.905 0.025 0.03 2.236 0.0001
Gastric cancer 2 1.767 0.222 3.313 0.025 0.03 2.241 0.0001
Breast cancer 1 1.31 −0.787 3.407 0.221 N/A 1.224 N/A
Colorectal cancer 2 1.195 −0.376 2.766 0.136 0.14 1.491 0.0001
Age group
50 – 55=1 2 1.095 −0.434 2.624 0.161 0.16 1.403 0.0000
56 – 60=2 6 1.63 0.695 2.565 <0.001 0.00 3.416 0.0001
61 – 65=3 3 1.607 0.244 2.969 0.021 0.02 2.311 0.0001
66 – 70=4 1 1.42 −0.932 3.772 0.237 N/A 1.183 N/A
Sex
Male 9 1.498 0.752 2.244 <0.001 0.00 3.937 0.0001
Female 6 1.458 0.524 2.393 0.002 0.00 3.058 0.0001
Tumor stage
I–IV 6 1.717 0.773 2.662 <0.001 0.00 3.563 0.0000
I–III & IV 3 1.647 0.345 2.95 0.013 0.01 2.479 0.0001
I–III 2 1.012 −0.53 2.553 0.198 0.2 1.287 0.0001
III–IV 1 1.1 −1.134 3.334 0.335 N/A 0.965 N/A
I 1 1.31 −0.905 3.525 0.246 N/A 1.159 N/A
III 1 1.42 −0.932 3.772 0.237 N/A 1.183 N/A
SIRT1 expression level
Low 5 1.243 0.286 2.199 0.011 0.01 2.547 0.0001
High 10 1.624 0.889 2.36 <0.001 0.00 4.329 0.0000
Note: N/A: Not applicable for single-study analysis.
Abbreviations: No.: Number; Sig.: Significance.
results within each subgroup, indicating robust findings trim-and-fill analysis provided no significant evidence
across different variables in the current study. of publication bias in the present study (Egger’s test:
P = 0.752; trim-and-fill analysis: P < 0.001). However, the
3.4. Publication bias aggregation of primary studies at the base of the funnel plot
Despite concerns raised by the absence of heterogeneity and the asymmetry in the bubble plot (Figure 4A and B)
in the overall meta-analysis, both Egger’s test and the may raise concerns. Consequently, the non-significant
Volume 4 Issue 1 (2025) 7 doi: 10.36922/gpd.4294