
Page 109 - GTM-2-3
P. 109
Global Translational Medicine TEs link to Parkinson’s risk and progression
to SNPs (Figure 1C), the cis-TE-eQTL region was expanded 3. Results
from the typical 1 Mb range used in SNP QTL studies to a
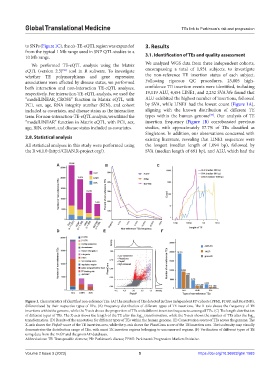
10 Mb range. 3.1. Identification of TEs and quality assessment
We performed TE-eQTL analysis using the Matrix We analyzed WGS data from three independent cohorts,
eQTL (version 2.3) tool in R software. To investigate encompassing a total of 1,931 subjects, to investigate
[56]
whether TE polymorphisms and gene expression the non-reference TE insertion status of each subject.
associations were affected by disease status, we performed Following rigorous QC procedures, 25,805 high-
both interaction and non-interaction TE-eQTL analyses, confidence TE insertion events were identified, including
respectively. For interaction-TE-eQTL analysis, we used the 19,119 ALU, 4,454 LINE1, and 2,232 SVA.We found that
“modelLINEAR_CROSS” function in Matrix eQTL, with ALU exhibited the highest number of insertions, followed
PC1, sex, age, RNA integrity number (RIN), and cohort by SVA, while LINE1 had the lowest count (Figure 1A),
included as covariates, and disease status as the interaction aligning with the known distribution of different TE
[57]
term. For non-interaction-TE-eQTL analysis, we utilized the types within the human genome . Our analysis of TE
“modelLINEAR” function in Matrix eQTL, with PC1, sex, insertion frequency (Figure 1B) corroborated previous
age, RIN, cohort, and disease status included as covariates. studies, with approximately 57.7% of TEs classified as
Singletons. In addition, our observations concurred with
2.8. Statistical analysis existing literature, revealing that LINE1 sequences were
All statistical analyses in this study were performed using the longest (median length of 1,094 bp), followed by
the R v4.1.0 (http://CRAN.R-project.org/). SVA (median length of 691 bp), and ALU, which had the
A B C
D E F
Figure 1. Characteristics of identified non-reference TEs. (A) The numbers of TEs detected in three independent PD cohorts (PPMI, PDBP, and BioFIND),
differentiated by their respective types of TEs. (B) Frequency distribution of different types of TE insertions. The X-axis shows the frequency of TE
insertions within the genome, while the Y-axis shows the proportion of TEs with different insertion frequencies among all TEs. (C) The length distribution
of different types of TEs. The X-axis shows the length of the TE after the log transformation, while the Y-axis shows the number of TEs after the log
10
10
transformation. (D) Results of the annotation for different types of TEs within the human genome. (E) Conservation scores of TEs across the genome. The
X-axis shows the PhyloP score of the TE insertion area, while the y-axis shows the PhastCons score of the TE insertion area. The isodensity map visually
demonstrates the distribution range of TEs, with most TE insertion regions belonging to unconserved regions. (F) Verification of different types of TE
using data from the 1KGP and the gnomAD databases.
Abbreviations: TE: Transposable element; PD: Parkinson’s disease; PPMI: Parkinson’s Progression Markers Initiative.
Volume 2 Issue 3 (2023) 5 https://doi.org/10.36922/gtm.1583