
Page 84 - GTM-2-4
P. 84
Global Translational Medicine Prognosis of relapse in squamous cell lung cancer
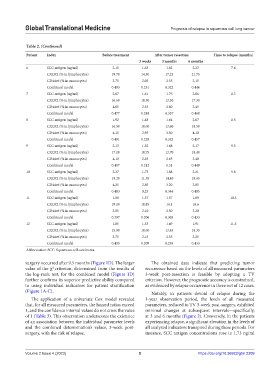
Table 2. (Continued)
Patient Index Before treatment After tumor resection Time to relapse (months)
3 weeks 3 months 6 months
6 SCC antigen (ng/ml) 2.15 1.63 1.82 2.23 7.6
CXCR2 (% in lymphocytes) 19.70 14.30 17.25 21.75
CD44v6 (% in monocytes) 3.75 2.05 2.55 3.15
Combined model 0.493 0.231 0.322 0.446
7 SCC antigen (ng/ml) 2.07 1.61 1.76 2.06 8.3
CXCR2 (% in lymphocytes) 16.60 10.50 13.30 17.30
CD44v6 (% in monocytes) 4.05 2.35 2.80 3.45
Combined model 0.477 0.248 0.337 0.468
8 SCC antigen (ng/ml) 1.92 1.48 1.64 2.07 8.5
CXCR2 (% in lymphocytes) 16.50 10.60 13.60 18.50
CD44v6 (% in monocytes) 4.15 2.95 3.50 4.10
Combined model 0.491 0.229 0.322 0.457
9 SCC antigen (ng/ml) 2.13 1.52 1.68 2.17 9.5
CXCR2 (% in lymphocytes) 17.10 10.75 13.70 18.40
CD44v6 (% in monocytes) 4.10 2.25 2.65 3.40
Combined model 0.407 0.212 0.31 0.449
10 SCC antigen (ng/ml) 2.27 1.73 1.88 2.21 9.8
CXCR2 (% in lymphocytes) 18.20 11.55 14.40 18.65
CD44v6 (% in monocytes) 4.25 2.85 3.20 3.85
Combined model 0.483 0.25 0.344 0.485
11 SCC antigen (ng/ml) 1.80 1.37 1.57 1.89 10.3
CXCR2 (% in lymphocytes) 19.10 10.85 14.1 18.6
CD44v6 (% in monocytes) 3.85 2.10 2.50 3.20
Combined model 0.397 0.206 0.305 0.433
12 SCC antigen (ng/ml) 1.85 1.33 1.49 1.91 11.5
CXCR2 (% in lymphocytes) 15.90 10.60 13.45 18.35
CD44v6 (% in monocytes) 3.75 2.15 2.55 3.25
Combined model 0.405 0.209 0.295 0.433
Abbreviation: SCC: Squamous cell carcinoma.
surgery occurred after 9.5 months (Figure 1D). The larger The obtained data indicate that predicting tumor
value of the χ criterion, determined from the results of recurrence based on the levels of all measured parameters
2
the log-rank test, for the combined model (Figure 1D) 3-week post-resection is feasible by adopting a TV
further confirms its superior predictive ability compared criterion. However, the prognostic accuracy is constrained,
to using individual indicators for patient stratification as evidenced by relapse occurrence in three out of 12 cases.
(Figure 1A-C). Notably, in patients devoid of relapse during the
The application of a univariate Cox model revealed 1-year observation period, the levels of all measured
that, for all measured parameters, the hazard ratios exceed parameters, reduced to TV 3-week post-surgery, exhibited
1, and the confidence interval values do not cross the value minimal changes at subsequent intervals—specifically,
of 1 (Table 3). This observation underscores the existence at 3 and 6 months (Figure 2). Conversely, in the patients
of an association between the individual parameter levels experiencing relapse, a significant elevation in the levels of
and the combined determination’s values, 3-week post- all analyzed indicators transpired during these periods. For
surgery, with the risk of relapse. instance, SCC antigen concentrations rose to 1.73 ng/ml
Volume 2 Issue 4 (2023) 5 https://doi.org/10.36922/gtm.2209