
Page 85 - GTM-2-4
P. 85
Global Translational Medicine Prognosis of relapse in squamous cell lung cancer
A B
C
D
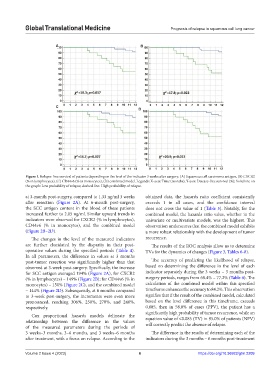
Figure 1. Relapse-free survival of patients depending on the level of the indicator 3 weeks after surgery: (A) Squamous cell carcinoma antigen, (B) CXCR2
(% in lymphocytes), (C) CD44v6 (% in monocytes), (D) combined model. Legends: X-axis: Time (months); Y-axis: Disease-free survival (%); Solid line on
the graph: Low probability of relapse; dashed line: High probability of relapse.
at 3-month post-surgery, compared to 1.33 ng/ml 3 weeks obtained data, the hazards ratio coefficient consistently
after resection (Figure 2A). At 6-month post-surgery, exceeds 1 in all cases, and the confidence interval
the SCC antigen content in the blood of these patients does not cross the value of 1 (Table 5). Notably, for the
increased further to 2.05 ng/ml. Similar upward trends in combined model, the hazards ratio value, whether in the
indicators were observed for CXCR2 (% in lymphocytes), univariate or multivariate models, was the highest. This
CD44v6 (% in monocytes), and the combined model observation underscores that the combined model exhibits
(Figure 2B–2D). a more robust relationship with the development of tumor
The changes in the level of the measured indicators recurrence.
are further elucidated by the disparity in their post- The results of the ROC analysis allow us to determine
operative values during the specified periods (Table 4). TVs for the dynamics of changes (Figure 3, Tables 6-8).
In all parameters, the difference in values at 3 months
post-tumor resection was significantly higher than that The accuracy of predicting the likelihood of relapse,
observed at 3-week post-surgery. Specifically, the increase based on determining the difference in the level of each
for SCC antigen averaged 194% (Figure 2A), for CXCR2 indicator separately during the 3 weeks – 3 months post-
(% in lymphocytes) – 149% (Figure 2B); for CD44v6 (% in surgery periods, ranges from 68.4% – 77.2% (Table 6). The
monocytes) – 150% (Figure 2C), and the combined model calculation of the combined model within this specified
– 144% (Figure 2D). Subsequently, at 6 months compared timeframe enhances the accuracy to 84.2%. This observation
to 3-week post-surgery, the increments were even more signifies that if the result of the combined model, calculated
pronounced, reaching 306%, 250%, 270%, and 240%, based on the level difference in this timeframe, exceeds
respectively. 0.085, then in 58.8% of cases (PPV), the patient has a
significantly high probability of tumor recurrence, while an
Cox proportional hazards models delineate the
relationship between the difference in the values equation value of ≤0.085 (TV) in 95.0% of patients (NPV)
of the measured parameters during the periods of will correctly predict the absence of relapse.
3 weeks–3 months, 3–6 months, and 3 weeks–6 months The difference in the results of determining each of the
after treatment, with a focus on relapse. According to the indicators during the 3 months – 6 months post-treatment
Volume 2 Issue 4 (2023) 6 https://doi.org/10.36922/gtm.2209