
Page 88 - GTM-2-4
P. 88
Global Translational Medicine Prognosis of relapse in squamous cell lung cancer
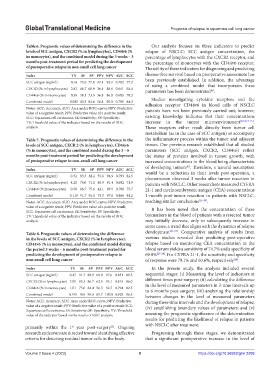
Table 6. Prognostic values of determining the difference in the Our analysis focuses on three indicators to predict
levels of SCC antigen, CXCR2 (% in lymphocytes), CD44v6 (% relapse of NSCLC: SCC antigen concentration, the
in monocytes), and the combined model during the 3 weeks – 3 percentage of lymphocytes with the CXCR2 receptor, and
months post‑treatment period for predicting the development the percentage of monocytes with the CD44v6 receptor.
of postoperative relapse in non‑small cell lung cancer The utility of these indicators for diagnosing and predicting
Index TV SE SP PPV NPV AUC ACC disease-free survival based on preoperative assessment has
SCC antigen (ng/ml) 0.16 75.0 77.8 47.4 92.1 0.702 77.2 been previously established. In addition, the advantage
of using a combined model that incorporates these
CXCR2 (% in lymphocytes) 2.82 66.7 68.9 36.4 88.6 0.641 68.4 parameters has been demonstrated .
[6]
CD44v6 (% in monocytes) 0.38 58.3 73.3 36.8 86.8 0.683 70.2
Studies investigating cytokine receptors and the
Combined model 0.085 83.3 84.4 58.8 95.0 0.799 84.2 adhesion receptor CD44v6 in blood cells of NSCLC
Notes: ACC: Accuracy; AUC: Area under ROC-curve; NPV: Predictive patients have not been previously carried out; however,
value of a negative result; PPV: Predictive value of a positive result;
SCC: Squamous cell carcinoma; SE: Sensitivity; SP: Specificity; existing knowledge indicates that their concentrations
TV: Threshold value of the indicator based on the results of ROC increase in the tumor microenvironment [9,10,12-15] .
analysis. These receptors either result directly from tumor cell
metabolism (as in the case of SCC antigen) or accompany
Table 7. Prognostic values of determining the difference in the the inflammatory process within the tumor and adjacent
levels of SCC antigen, CXCR 2 (% in lymphocytes), CD44v6 tissues. Our previous research established that all studied
(% in monocytes), and the combined model during the 3 – 6 parameters (SCC antigen, CXCR2, CD44v6) reflect
months post‑treatment period for predicting the development the status of proteins involved in tumor growth, with
of postoperative relapse in non‑small cell lung cancer increased concentrations in the blood being characteristic
of developing tumors . Therefore, a natural assumption
[6]
Index TV SE SP PPV NPV AUC ACC would be a reduction in their levels post-operation, a
SCC antigen (ng/ml) 0.32 83.3 82.2 55.6 94.9 0.793 82.5 phenomenon observed 3 weeks after tumor resection in
CXCR2 (% in lymphocytes) 4.20 75.0 71.1 40.9 91.4 0.692 71.9 patients with NSCLC. Other researchers measured CYFRA
CD44v6 (% in monocytes) 0.58 66.7 75.6 42.1 89.5 0.708 73.7 21-1 and carcinoembryonic antigen (CEA) concentrations
Combined model 0.119 91.7 91.1 73.3 97.6 0.866 91.2 1-month post-tumor resection in patients with NSCLC,
Notes: ACC: Accuracy; AUC: Area under ROC-curve; NPV: Predictive reaching similar conclusions [16-20] .
value of a negative result; PPV: Predictive value of a positive result; It has been noted that the concentration of these
SCC: Squamous cell carcinoma; SE: Sensitivity; SP: Specificity;
TV: Threshold value of the indicator based on the results of ROC biomarkers in the blood of patients with a resected tumor
analysis. may initially decrease, only to subsequently increase in
some cases, a trend that aligns with the dynamics of relapse
Table 8. Prognostic values of determining the difference development [21-24] . Comparative analysis of results from
in the levels of SCC antigen, CXCR2 (% in lymphocytes), various studies revealed that predicting post-operative
CD44v6 (% in monocytes), and the combined model during relapse based on monitoring CEA concentration in the
the period 3 weeks – 6 months post‑treatment period for blood serum yields a sensitivity of 74.7% and a specificity of
predicting the development of postoperative relapse in 69.8% [21-24] . For CYFRA 21-1, the sensitivity and specificity
non‑small cell lung cancer of response were 79.1% and 60.6%, respectively .
[24]
Index TV SE SP PPV NPV AUC ACC In the present study, the analysis included several
SCC antigen (ng/ml) 0.47 91.7 88.9 68.8 97.6 0.831 89.5 sequential stages: (i) Measuring the level of indicators at
different times post-surgery; (ii) calculating the difference
CXCR2 (% in lymphocytes) 7.05 83.3 86.7 62.5 95.1 0.815 86.0
in the level of measured parameters in 3-time intervals up
CD44v6 (% in monocytes) 1.01 75.0 84.4 56.3 92.7 0.794 82.5 to 6 months post-surgery; (iii) analyzing the relationship
Combined model 0.195 100 95.6 85.7 100.0 0.928 96.5 between changes in the level of measured parameters
Notes: ACC: Accuracy; AUC: Area under ROC-curve; NPV: Predictive during these time intervals and the development of relapse;
value of a negative result; PPV: Predictive value of a positive result; SCC: (iv) establishing boundary values of parameters; and (v)
Squamous cell carcinoma; SE: Sensitivity; SP: Specificity; TV: Threshold
value of the indicator based on the results of ROC analysis. assessing the prognostic significance of the determination
results for predicting the likelihood of relapse in patients
primarily within the 1 year post-surgery . Ongoing with NSCLC after treatment.
st
[1]
research endeavors are directed toward identifying effective Progressing through these stages, we demonstrated
criteria for detecting residual tumor cells in the body. that a significant postoperative increase in the level of
Volume 2 Issue 4 (2023) 9 https://doi.org/10.36922/gtm.2209