
Page 111 - GTM-3-4
P. 111
Global Translational Medicine Laser influence on cytokine secretion
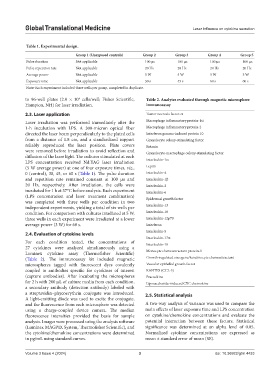
Table 1. Experimental design.
Group 1 (Unexposed controls) Group 2 Group 3 Group 4 Group 5
Pulse duration Not applicable 100 µs 100 µs 100 µs 100 µs
Pulse repetition rate Not applicable 20 Hz 20 Hz 20 Hz 20 Hz
Average power Not applicable 5 W 5 W 5 W 3 W
Exposure time Not applicable 30 s 45 s 60 s 60 s
Note: Each experiment included three wells per group, completed in duplicate.
to 96-well plates (2.0 × 10 cells/well; Fisher Scientific, Table 2. Analytes evaluated through magnetic microsphere
4
Hampton, NH) for laser irradiation. immunoassay
2.3. Laser application Tumor necrosis factor-α
Laser irradiation was performed immediately after the Macrophage inflammatory protein-1α
1-h incubation with LPS. A 300-micron optical fiber Macrophage inflammatory protein-2
directed the laser beam perpendicularly to the plated cells Interferon gamma-induced protein 10
from a distance of 1.8 cm, and a standardized support Granulocyte colony-stimulating factor
reliably reproduced the laser position. Plate covers Eotaxin
were removed before irradiation to avoid reflection and Granulocyte-macrophage colony-stimulating factor
diffusion of the laser light. The cultures stimulated at each
LPS concentration received Nd:YAG laser irradiation Interleukin-1α
(5 W average power) at one of four exposure times, viz., Leptin
0 (control), 30, 45, or 60 s (Table 1). The pulse duration Interleukin-4
and repetition rate remained constant at 100 µs and Interleukin-1β
20 Hz, respectively. After irradiation, the cells were Interleukin-2
incubated for 1 h at 37°C before analysis. Each experiment Interleukin-6
(LPS concentration and laser treatment combination) Epidermal growth factor
was completed with three wells per condition in two
independent experiments, yielding a total of six wells per Interleukin-13
condition. For comparison with cultures irradiated at 5 W, Interleukin-10
three wells in each experiment were irradiated at a lower Interleukin-12p70
average power (3 W) for 60 s. Interferon
Interleukin-5
2.4. Evaluation of cytokine levels
Interleukin-17α
For each condition tested, the concentrations of Interleukin-18
27 cytokines were analyzed simultaneously using a
Luminex cytokine assay (Thermofisher Scientific) Monocyte chemoattractant protein-1
(Table 2). The immunoassay kit included magnetic Growth-regulated oncogene/keratinocyte chemoattractant
microspheres tagged with fluorescent dyes covalently Vascular epithelial growth factor
coupled to antibodies specific for cytokines of interest RANTES (CCL-5)
(capture antibodies). After incubating the microspheres Fractalkine
for 2 h with 200 µL of culture media from each condition, Liposaccharide-induced CXC chemokine
a secondary antibody (detection antibody) labeled with
a streptavidin–phycoerythrin conjugate was introduced. 2.5. Statistical analysis
A light-emitting diode was used to excite the conjugate,
and the fluorescence from each microsphere was detected A two-way analysis of variance was used to compare the
using a charge-coupled device camera. The median main effects of laser exposure time and LPS concentration
fluorescence intensities provided the basis for sample on cytokine/chemokine concentrations and evaluate the
analysis. Images were processed using the analysis software potential interaction between these factors. Statistical
(Luminex MAGPIX System, Thermofisher Scientific), and significance was determined at an alpha level of 0.05.
the cytokine/chemokine concentrations were determined Normalized cytokine concentrations are expressed as
in pg/mL using standard curves. mean ± standard error of mean (SE).
Volume 3 Issue 4 (2024) 3 doi: 10.36922/gtm.4433