
Page 119 - GTM-3-4
P. 119
Global Translational Medicine Sleep apnea in patients with tachyarrhythmias
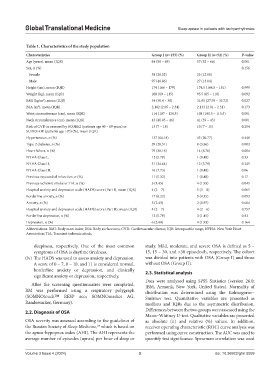
Table 1. Characteristics of the study population
Characteristics Group I (n=155) (%) Group II (n=52) (%) P‑value
Age (years), mean (IQR) 64 (58 – 69) 57 (52 – 66) 0.001
Sex, n (%) 0.156
Female 58 (28.02) 25 (12.08)
Male 97 (46.86) 27 (13.04)
Height (cm), mean (IQR) 174 (166 – 179) 174.5 (164.5 – 181) 0.999
Weight (kg), mean (IQR) 100 (89 – 115) 95.5 (85 – 110) 0.092
BMI (kg/m ), mean (IQR) 34 (30.4 – 38) 31.65 (27.95 – 35.72) 0.027
2
BSA (m ), mean (IQR) 2.182 (2.05 – 2.34) 2.133 (2.01 – 2.31) 0.173
2
Waist circumference (cm), mean (IQR) 114 (107 – 124.5) 108 (100.5 – 115.5) 0.001
Neck circumference (cm), mean (IQR) 43 (40.85 – 46) 41 (39 – 43) 0.001
Risk of CVD as assessed by SCORE2 (patients age 40 – 69 years) or 13 (7 – 18) 10 (7 – 15) 0.254
SCORE-OP (patients age >70) (%), mean (IQR)
Hypertension, n (%) 137 (66.18) 43 (20.77) 0.448
Type-2 diabetes, n (%) 59 (28.51) 8 (3.86) 0.003
Heart failure, n (%) 79 (38.16) 14 (6.76) 0.004
NYHA Class I, 12 (5.79) 1 (0.48) 0.33
NYHA Class II, 51 (24.64) 12 (5.79) 0.249
NYHA Class III, 16 (7.73) 1 (0.48) 0.06
Previous myocardial infarction, n (%) 11 (5.32) 1 (0.48) 0.17
Previous ischemic stroke or TIA, n (%) 3 (1.45) 4 (1.93) 0.045
Hospital anxiety and depression scale (HADS) score (Part I), mean (IQR) 4 (2 – 7) 5 (3 – 8) 0.065
Borderline anxiety, n (%) 17 (8.22) 9 (4.35) 0.093
Anxiety, n (%) 5 (2.43) 2 (0.97) 0.684
Hospital anxiety and depression scale (HADS) score (Part II), mean (IQR) 4 (2 – 7) 4 (2 – 6) 0.757
Borderline depression, n (%) 12 (5.79) 3 (1.45) 0.82
Depression, n (%) 6 (2.89) 4 (1.93) 0.164
Abbreviations: BMI: Body mass index; BSA: Body surface area; CVD: Cardiovascular disease; IQR: Interquartile range; NYHA: New York Heart
Association; TIA: Transient ischemic attack.
sleepiness, respectively. One of the most common study. Mild, moderate, and severe OSA is defined as 5 –
symptoms of OSA is daytime tiredness. 15, 15 – 30, and >30 episodes/h, respectively. The cohort
(iv) The HADS was used to assess anxiety and depression. was divided into patients with OSA (Group I) and those
A score of 0 – 7, 8 – 10, and 11 is considered normal, without OSA (Group II).
borderline anxiety or depression, and clinically 2.3. Statistical analysis
significant anxiety or depression, respectively.
Data were analyzed using SPSS Statistics (version 26.0;
After the screening questionnaires were completed, IBM, Armonk, New York, United States). Normality of
RM was performed using a respiratory polygraph distribution was determined using the Kolmogorov–
(SOMNOtouch™ RESP eco; SOMNOmedics AG, Smirnov test. Quantitative variables are presented as
Randersacker, Germany). medians and IQRs due to the asymmetric distribution.
2.2. Diagnosis of OSA Differences between the two groups were assessed using the
Mann–Whitney U-test. Qualitative variables are presented
OSA severity was assessed according to the guidelines of as absolute (n) and relative (%) values. In addition,
the Russian Society of Sleep Medicine, which is based on receiver operating characteristic (ROC) curve analysis was
24
the apnea-hypopnea index (AHI). The AHI represents the performed using curve construction. The AUC was used to
average number of episodes (apnea) per hour of sleep or quantify test significance. Spearman correlation was used
Volume 3 Issue 4 (2024) 3 doi: 10.36922/gtm.5059