
Page 120 - GTM-3-4
P. 120
Global Translational Medicine Sleep apnea in patients with tachyarrhythmias
to analyze the correlation between the questionnaire scores Borderline anxiety (HADS scale) was more common
and AHI. A P < 0.05 was considered statistically significant. in Group I than in Group II (17 vs. 9; OR 1.235 [95% CI:
0.92 – 1.659]; P = 0.093); however, this was not statistically
3. Results significant.
According to the RM results, 155 patients had OSA Pulmonary vein radiofrequency isolation (67 vs. 29; OR
(Group I) and 52 patients did not have OSA (Group II). 1.263 [95% CI: 1.034 – 1.543]; P = 0.038) and cavotricuspid
Patients in Group I were older than those in Group II isthmus radiofrequency ablation (17 vs. 1; OR 0.678 [95%
(64 vs. 57 years; P = 0.001). Both groups exhibited high CI: 0.578 – 0.794]; P = 0.001) were performed more
and very high risk for CVS according to the SCORE-2 frequently in Group I than in Group II (Table 3).
and SCORE-OP scales, respectively. The SCORE-2 scale
is designed to calculate the total risk of fatal and non- 3.1. RM
fatal CVS and assess the 10-year risk of fatal and non- Key RM parameters are presented in Table 4. Sleep
fatal cardiovascular events (e.g., myocardial infarction efficiency was high in both groups (>85%). Among the
and stroke) in people 40–69 years of age with risk factors. 155 patients in Group I, 59 (28.5%) had mild, 50 (24.2%)
The SCORE2-OP scale complements the SCORE-2 scale had moderate, and 46 (22.3%) had severe disease.
and estimates the 5-and 10-year risk of fatal and non-fatal
cardiovascular events, adjusted for competing risks, in 3.2. Screening capabilities of the questionnaires
people aged > 70 years. The Epworth Sleepiness Scale exhibited a low risk of
Patients in Group I had a higher BMI (34 vs. 31.65 kg/m²; OSA (OR 1.897; 95% CI: 0.406 – 8.851; P = 0.408),
P = 0.027), waist circumference (114 vs. 108 cm; P = 0.001), with only 11 patients (5%) being identified as having
and neck circumference (43 vs. 41 cm; P = 0.001) than OSA. By contrast, the STOP-BANG (OR 3.022; 95%
those in Group II. CI: 1.549 – 5.897; P = 0.001) and Berlin (OR 3.480; 95%
CI: 1.429 – 8.472; P = 0.004) Questionnaires identified a
Type 2 diabetes (59 vs. 8; P = 0.004) and heart failure higher risk of OSA.
(79 vs. 14; [OR] 0.797 [95% confidence interval {CI}: 0.683
– 0.929]; P = 0.004) were more common in Group I than in According to the ROC analysis, the Epworth Sleepiness
Group II. AF was significantly more common in Group I Scale exhibited a low predictive ability for OSA (sensitivity
than in Group II (113 vs. 46; OR 1.252 [95% CI: 1.088 – 15%; specificity 87%; AUC 0.543) (Figure 1).
1.441]; P = 0.013), particularly the paroxysmal form (84 vs. The STOP-BANG Sleep Apnea Risk Scale accurately
37; OR 1.238 [95% CI: 1.06 – 1.447]; P = 0.007) (Table 2). identified patients with OSA (AUC 0.708; sensitivity 79%;
Transient ischemic attacks were slightly more common in specificity 46%) (Table 5). The Berlin Questionnaire had
Group II than in Group I (4 vs. 3; OR 1.779 [95% CI: 0.754 the highest predictive ability (AUC 0.709; sensitivity 80%;
– 4.201]; P = 0.045). specificity 54%).
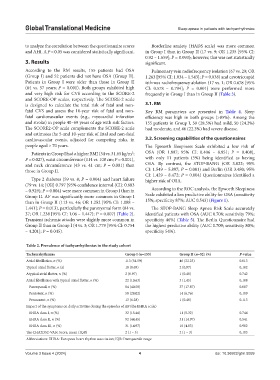
Table 2. Prevalence of tachyarrhythmias in the study cohort
Tachyarrhythmias Group I (n=155) Group II (n=52) (%) P‑value
Atrial fibrillation, n (%) 113 (54.59) 46 (22.23) 0.013
Typical atrial flutter, n (z) 18 (8.69) 2 (0.97) 0.102
Atypical atrial flutter, n (%) 2 (0.97) 1 (0.48) 0.742
Atrial fibrillation with typical atrial flutter, n (%) 22 (10.63) 3 (1.45) 0.108
Paroxysmal, n (%) 84 (40.58) 37 (17.87) 0.007
Persistent, n (%) 58 (28.02) 14 (6.76) 0.189
Permanent, n (%) 13 (6.28) 1 (0.48) 0.113
Impact of the symptoms on daily activities during the episodes of AF (the EHRA scale)
EHRA class I, n (%) 32 (15.46) 11 (5.32) 0.746
EHRA class II, n (%) 92 (44.45) 31 (14.97) 0.541
EHRA class III, n (%) 31 (14.97) 10 (4.83) 0.902
The CHA2DS2-VASc Score, mean (IQR) 2 (1 – 3) 2 (1 – 3) 0.183
Abbreviations: EHRA: European heart rhythm association; IQR: Interquartile range.
Volume 3 Issue 4 (2024) 4 doi: 10.36922/gtm.5059