
Page 121 - GTM-3-4
P. 121
Global Translational Medicine Sleep apnea in patients with tachyarrhythmias
Table 3. Interventions performed in the study population Table 5. ROC analysis of the STOP‑BANG sleep apnea risk
scale, Berlin questionnaire, and Epworth sleepiness scale
Interventions Group I Group II P‑value
(n=155) (%) (n=52) (%) Parameters STOP‑BANG sleep Berlin Epworth
Radiofrequency PVI, n (%) 67 (32.37) 29 (14.01) 0.038 apnea risk scale questionnaire sleepiness
scale
Radiofrequency CTIA, n (%) 27 (13.04) 1 (0.48) 0.001
Area under 0.708 0.709 0.543
Cryoballoon PVI, n (%) 13 (6.28) 6 (2.89) 0.497 the curve
PVI+CTIA, n (%) 5 (2.43) 5 (2.43) 0.106 95% confidence 0.619 – 0.797 0.619 – 0.799 0.446 – 0.64
Electrical cardioversion, n (%) 49 (23.67) 11 (5.32) 0.67 interval
Abbreviations: CTIA: Cavotricuspid isthmus ablation; PVI: Pulmonary P-value 0.0001 0.0001 0.417
vein isolation. Sensitivity 79% 80% 15%
Specificity 46% 54% 87%
Table 4. Respiratory monitoring data of the study
participants Abbreviation: ROC: Receiver operating characteristic.
Respiratory monitoring data Group I (n=155) Group II (n=52)
Sleep efficiency (%), 92.7 (84.9 – 95.6) 90.75 (86.8 – 96.1)
mean (IQR)
AHI (episodes per hour), 18.4 (10.2 – 32.75) 2.3 (1.5 – 3.1)
mean (IQR)
Obstructive sleep 7.4 (3.85 – 15.85) 0.5 (0.2 – 1.05)
apnea index, mean (IQR)
Mixed apnea index, 0 (0 – 1) 0 (0 – 0)
mean (IQR)
Central apnea index, 0.3 (0 – 2.3) 0 (0 – 0.25)
mean (IQR)
Maximum duration of 40 (26.5 – 60) 19 (12.5 – 23.5)
apnea (seconds), mean (IQR)
Average duration of apnea 19.1 (15.2 – 24.25) 12.8 (11.3 – 15)
(seconds), mean (IQR)
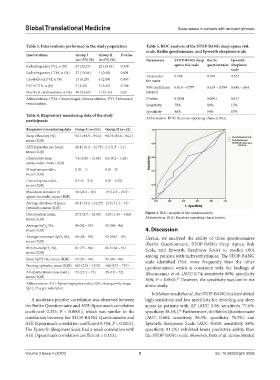
Desaturation index, 17.2 (9.7 – 32.05) 3.05 (1.65 – 5.05) Figure 1. ROC analysis of the questionnaires
mean (IQR) Abbreviation: ROC: Receiver operating characteristic.
Average SpO (%), 94 (92 – 95) 95 (94 – 96)
2
mean (IQR) 4. Discussion
Average minimum SpO (%), 90 (88 – 92) 92 (90.5 – 93) Herein, we analyzed the ability of three questionnaires
2
mean (IQR) (Berlin Questionnaire, STOP-BANG Sleep Apnea Risk
Minimum SpO (%), 81 (75 – 86) 86.5 (84 – 91) Scale, and Epworth Sleepiness Scale) to predict OSA
2
mean (IQR) among patients with tachyarrhythmias. The STOP-BANG
Basal SpO2 (%), mean (IQR) 94 (93 – 96) 95 (94 – 96) scale identified OSA more frequently than the other
Snoring episodes, mean (IQR) 607 (218 – 1272) 400 (137 – 791) questionnaires, which is consistent with the findings of
All desaturations sum (min), 43 (21.5 – 73) 28 (14 – 72) Abumuamar et al. (AUC 0.74; sensitivity 89%; specificity
mean (IQR) 36%; P = 0.004). However, the specificity was low in the
25
Abbreviations: AHI: Apnea-hypopnea index; IQR: Interquartile range; above study.
SpO : Oxygen saturation.
2
In Mohammadieh et al., the STOP-BANG Scale exhibited
A moderate positive correlation was observed between high sensitivity and low specificity for detecting any sleep
the Berlin Questionnaire and AHI (Spearman’s correlation apnea in patients with AF (AUC 0.58; sensitivity 77.6%;
coefficient 0.353; P < 0.0001), which was similar to the specificity 38.5%). Furthermore, the Berlin Questionnaire
26
correlation between the STOP-BANG Questionnaire and (AUC 0.664; sensitivity 56.3%; specificity 76.5%) and
AHI (Spearman’s correlation coefficient 0.358; P < 0.0001). Epworth Sleepiness Scale (AUC 0.608; sensitivity 88%;
The Epworth Sleepiness Scale had a weak correlation with specificity 91.2%) exhibited lower predictive ability than
AHI (Spearman’s correlation coefficient = 0.113). the STOP-BANG scale. However, Betz et al. demonstrated
Volume 3 Issue 4 (2024) 5 doi: 10.36922/gtm.5059