
Page 71 - GTM-3-4
P. 71
Global Translational Medicine New neck examination for sleep apnea
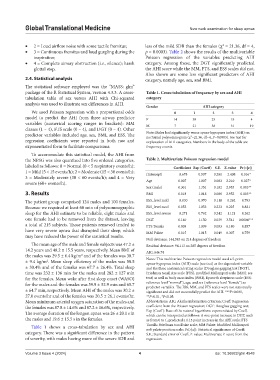
• 2 = Loud airflow noise with some tactile fremitus; less of the mild SDB than the females (χ = 21.36, df = 4,
2
• 3 = Continuous fremitus and loud gurgling during the p = 0.0003). Table 2 shows the results of the multivariable
inspiration; Poisson regression of the variables predicting AHI
• 4 = Complete airway obstruction (i.e., silence); harsh category. Among these, the DGT significantly predicted
glottal stop. the AHI score while the MM, FTS, and ESS scales did not.
Also shown are some less significant predictors of AHI
2.4. Statistical analysis category, namely age, sex, and BMI.
The statistical software employed was the “MASS: glm”
package of the R Statistical System, version 4.3.3. A cross- Table 1. Cross‑tabulation of frequency by sex and AHI
tabulation table of sex versus AHI with Chi-squared category
analysis was used to illustrate sex differences in AHI.
Gender AHI category
We used Poisson regression with a proportional odds 0 1 2 3 4
model to predict the AHI from three airway predictor F 14 38 25 18 4
variables (numerical scoring ranges in brackets): MM M 7 21 38 31 19
classes (1 – 4), FTS scale (0 – 4), and DGT (0 – 4). Other
predictor variables included age, sex, BMI, and ESS. The Note: Males had significantly worse apnea-hypopnea index (AHI) on
nocturnal polysomnogram (χ =21.36, df=4, P=0.0003). See text for
2
regression coefficients were reported in both raw and explanation of AHI categories. Numbers in the body of the table are
exponentiated form to facilitate comparisons. frequency counts.
To accommodate this statistical model, the AHI from
the NPSG was also quantized into five ordered categories, Table 2. Multivariate Poisson regression model
labeled as follows: 0 = Normal (0 < 5 respiratory events/h); Coefficient Exp (Coeff) S.E. Z‑value Pr(>|z|)
1 = Mild (5 < 15 events/h); 2 = Moderate (15 < 30 events/h); (Intercept) −0.678 0.507 0.281 −2.408 0.016*
3 = Moderately severe (30 < 60 events/h); and 4 = Very
severe (60+ events/h). Age 0.007 1.007 0.003 2.210 0.027*
Sex (male) 0.301 1.351 0.102 2.953 0.003**
3. Results BMI 0.018 1.018 0.006 2.952 0.003**
The patient group comprised 124 males and 100 females. ESS_level mild −0.030 0.970 0.118 −0.262 0.793
Because we required at least 60 min of polysomnographic ESS_level mod 0.052 1.053 0.233 0.225 0.821
sleep for the AHI estimate to be reliable, eight males and ESS_level severe −0.271 0.762 0.242 −1.121 0.262
one female had to be removed from the dataset, leaving DGT 0.140 1.150 0.039 3.541 0.0004***
a total of 215 subjects. Those patients removed tended to FTS Tonsils 0.009 1.009 0.053 0.180 0.857
have very severe apnea that disrupted their sleep, which MM Palate 0.015 1.015 0.049 0.307 0.759
may have reduced the power of the statistical results.
Null deviance: 144.583 on 214 degrees of freedom
The mean age of the male and female subjects was 47.2 ± Residual deviance: 96.113 on 205 degrees of freedom
14.2 years and 48.2 ± 15.5 years, respectively. Mean BMI of AIC: 646.74
the males was 29.5 ± 6.4 kg/m and of the females was 30.7
2
± 9.4 kg/m . Mean sleep efficiency of the males was 58.5 Notes: This multivariate Poisson regression model used a 5-point
2
apnea-hypopnea index (AHI) scale (see text) as the dependent variable
± 30.4% and of the females was 67.7 ± 26.4%. Total sleep and the three anatomical rating scales (Douglass gagging test [DGT],
time was 232 ± 136 min for the males and 282 ± 127 min Friedman tonsil size scale [FTS], modified Mallampati scale [MM]; see
for the females. Mean wake after first sleep onset (WASO) text) as well as body mass index (BMI), Epworth sleepiness scale (ESS;
for the males and the females was 59.9 ± 52.9 min and 65.7 reference level “normal”), age, and sex (reference level “female”) as
predictor variables. The ESS, MM, and FTS scales were not statistically
± 64.7 min, respectively. Mean AHI of the males was 30.2 ± significant and did not successfully predict the AHI. ***P<0.001,
27.0 events/hr and of the females was 20.5 ± 26.1 events/hr. **P<0.01, *P<0.05.
Mean minimum arterial oxygen saturation of the males and Abbreviations: AIC: Akaike information criterion; Coeff: Regression
the females was 87.8 ± 14.6% and 87.2 ± 16.6%, respectively. coefficient from the Poisson regression; DGT: Douglass gagging test;
The average duration of the longest apnea was 26 ± 20.1 s in Exp (Coeff): Base of the natural logarithms exponentiated by Coeff,
which can be interpreted as follows: A one-point increase in DGT, such
the males and 19.6 ± 15.5 s in the females. as from 0 to 1, predicted a 1.15 point increase in the AHI scale; FTS
Table 1 shows a cross-tabulation by sex and AHI Tonsils: Friedman tonsil size scale; MM Palate: Modified Mallampati
soft palate position scale; Pr(>|z|): Statistical significance of Coeff;
category. There was a significant difference in the pattern S.E.: Standard error of Coeff; Z-value: Multivariate Z-score from the
of severity, with males having more of the severe SDB and regression.
Volume 3 Issue 4 (2024) 4 doi: 10.36922/gtm.4548