
Page 93 - GTM-3-4
P. 93
Global Translational Medicine Blood parameters for SCLC and AC relapse prognosis
Table 6. Cox proportional hazards models for selected laboratory parameters in III‑stage AC patients
Indicator Univariate model Multivariate model
HR 95% CI P‑value HR 95% CI p‑value
CXCR1, lymphocytes, % 1.137 1.005 – 1.275 0.012* 1.114 1.003 – 1.222 0.017*
CYFRA 21-1, ng/mL 1.215 1.009 – 1.419 0.016* 1.182 1.007 – 1.413 0.016*
Monocytes, ×10 /L 1.189 1.093 – 1.289 0.022* 1.162 1.074 – 1.254 0.024*
9
Eosinophilic leukocytes, ×10 /L 11.337 1.205 – 14.248 0.027* 10.121 1.181 – 13.325 0.031*
9
Eosinophilic leukocytes/Monocytes 12.153 1.511 – 22.799 0.019* 11.371 1.409 – 21.335 0.021*
Note: P<0.05 indicates the value is statistically significant.
Abbreviations: CXCR1: HR: Hazards ratio; 95% CI: 95% Confidence interval; CXCR1: C-X-C motif chemokine receptor 1; CYFRA 21-1: Cytokeratin
19 fragment antigen 21-1.
Table 7. Significance of determining laboratory parameters in blood for predicting low and high risk of recurrence in patients
with stage III SCLC (ROC analysis data)
Indicator TV SE SP PPV NPV AUC ACC
CXCR1, lymphocytes, % >2.25 75.3 79.5 79.5 76.3 0.729 76.7
CXCR2, monocytes, % >2.05 69.9 74.0 72.6 71.2 0.687 71.2
CYFRA 21-1, ng/mL >6.02 80.8 68.5 72.6 76.7 0.711 74.0
Y >0.417 84.9 89.0 90.4 84.9 0.831 87.7
Abbreviations: TV: Threshold value; SE: Sensitivity; SP: Specificity; PPV: Positive predictive value; NPV: Negative predictive value; AUC: Area under
ROC-curve; ACC: Accuracy; CXCR1: C-X-C motif chemokine receptor 1; CXCR2: C-X-C motif chemokine receptor 2; CYFRA 21-1: Cytokeratin 19
fragment antigen 21-1.
evidenced by the results of the ROC analysis. The AUC
of 0.841 indicates a “very good” quality of the prognostic
model. The optimal TV for distinguishing the low- and
14
high-risk groups of tumor recurrence is 0.597 (Table 8).
Specifically, if the value of Z > 0.597, the probability that
the patient has a high risk of tumor recurrence is 89.6%.
Conversely, if the value of Z ≤ 0.597, the probability that
the patient has a low risk of tumor recurrence is 84.4%.
exp( 14.022 0.539 *[CYFRA− + ]
+ 1.294 *[CXCR 1] 12.035*[ /E M+ ])
Z = (II)
1 exp( 14.022 0.539 *[CYFRA+ − + ]
+ 1.294 *[CXCR 1] 12.035*[ / M+ E ])
Logistic regression equation for predicting of relapse-
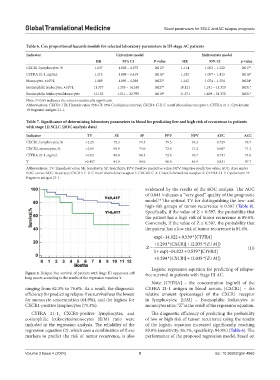
Figure 2. Relapse-free survival of patients with Stage III squamous cell free survival in patients with Stage III AC.
lung cancer according to the results of the regression equation Y.
Note: [CYFRA] – the concentration (ng/ml) of the
ranging from 62.3% to 76.6%. As a result, the diagnostic CYFRA 21-1 antigen in blood serum; [CXCR1] – the
efficiency for predicting relapse-free survival was the lowest relative amount (percentage) of the CXCR1 receptor
for monocyte concentration (64.9%), and the highest for in lymphocytes; [E/M] – Eosinophilic leukocytes to
CXCR1-positive lymphocytes (75.3%). monocytes ratio; “Z” is the result of the regression equation.
CYFRA 21-1, CXCR1-positive lymphocytes, and The diagnostic efficiency of predicting the probability
eosinophilic leukocytes/monocytes (E/M) ratio were of low or high risk of tumor recurrence using the results
included in the regression analysis. The reliability of the of the logistic equation increased significantly, reaching
regression equation (2), which uses a combination of these 89.0% (sensitivity: 85.7%, specificity: 94.8%) (Table 6). The
markers to predict the risk of tumor recurrence, is also performance of the proposed regression model, based on
Volume 3 Issue 4 (2024) 9 doi: 10.36922/gtm.4865