
Page 97 - GTM-4-2
P. 97
Global Translational Medicine Thyroid status in obesity
A B
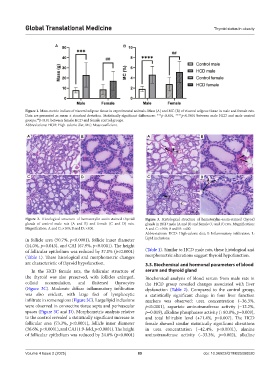
Figure 1. Mass-metric indices of visceral adipose tissue in experimental animals. Mass (A) and MC (B) of visceral adipose tissue in male and female rats.
Data are presented as mean ± standard deviation. Statistically significant differences: ***p<0.001, ****p<0.0001 between male HCD and male control
groups; p<0.01 between female HCD and female control groups.
##
Abbreviations: HCD: High-calorie diet; MC: Mass coefficient.
A B A B
C D C D
Figure 2. Histological structure of hematoxylin-eosin-stained thyroid Figure 3. Histological structure of hematoxylin-eosin-stained thyroid
glands of control male rats (A and B) and female (C and D) rats. glands in HCD male (A and B) and female (C and D) rats. Magnification:
Magnification: A and C: ×100; B and D: ×400. A and C: ×100; B and D: ×400.
Abbreviations: HCD: High-calorie diet; I: Inflammatory infiltration; L:
in follicle area (50.7%, p<0.0001), follicle inner diameter Lipid inclusions.
(14.0%, p=0.043), and CAI (67.9%, p<0.0001). The height
of follicular epithelium was reduced by 37.0% (p<0.0001) (Table 1). Similar to HCD male rats, these histological and
(Table 1). These histological and morphometric changes morphometric alterations suggest thyroid hypofunction.
are characteristic of thyroid hypofunction. 3.3. Biochemical and hormonal parameters of blood
In the HCD female rats, the follicular structure of serum and thyroid gland
the thyroid was also preserved, with follicles enlarged, Biochemical analysis of blood serum from male rats in
colloid accumulation, and flattened thyrocytes the HCD group revealed changes associated with liver
(Figure 3C). Moderate diffuse inflammatory infiltration dysfunction (Table 2). Compared to the control group,
was also evident, with large foci of lymphocytic a statistically significant change in four liver function
infiltrate in some regions (Figure 3C). Large lipid inclusions markers was observed: urea concentration (−36.3%,
were observed in connective tissue septa and perivascular p<0.0001), aspartate aminotransferase activity (−12.2%,
spaces (Figure 3C and D). Morphometric analysis relative p=0.019), alkaline phosphatase activity (+80.8%, p=0.009),
to the control revealed a statistically significant increase in and total bilirubin level (+71.4%, p=0.007). The HCD
follicular area (73.3%, p<0.0001), follicle inner diameter female showed similar statistically significant alterations
(36.6%, p<0.0001), and CAI (1.9-fold, p<0.0001). The height in urea concentration (−42.4%, p<0.0001), alanine
of follicular epithelium was reduced by 24.0% (p<0.0001) aminotransferase activity (−33.3%, p=0.002), alkaline
Volume 4 Issue 2 (2025) 89 doi: 10.36922/GTM025080020