
Page 99 - GTM-4-2
P. 99
Global Translational Medicine Thyroid status in obesity
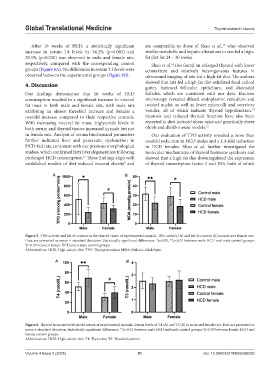
After 16 weeks of HCD, a statistically significant are comparable to those of Shao et al., who observed
14
increase in serum T4 levels by 34.2% (p=0.002) and similar metabolic and hepatic alterations in rats fed a high-
29.5% (p=0.020) was observed in male and female rats, fat diet for 24 – 30 weeks.
respectively, compared with the corresponding control Shao et al. also found an enlarged thyroid with lower
14
groups (Figure 6A). No differences in serum T3 levels were echotexture and relatively heterogeneous features in
observed between the experimental groups (Figure 6B). ultrasound imaging of rats fed a high-fat diet. The authors
4. Discussion showed that rats fed a high-fat diet exhibited focal colloid
goiter, flattened follicular epithelium, and distended
Our findings demonstrate that 16 weeks of HCD follicles, which are consistent with our data. Electron
consumption resulted in a significant increase in visceral microscopy revealed dilated endoplasmic reticulum and
fat mass in both male and female rats, with male rats twisted nuclei, as well as fewer microvilli and secretory
14
exhibiting an almost threefold increase and females a vesicles, all of which indicate thyroid hypofunction.
twofold increase compared to their respective controls. Steatosis and reduced thyroid function have also been
With increasing visceral fat mass, triglyceride levels in reported in diet-induced obese mice and genetically obese
both serum and thyroid tissues increased in male but not ob/ob and db/db mouse models. 15
in female rats. Analysis of serum biochemical parameters Our evaluation of TPO activity revealed a more than
further indicated liver and pancreatic dysfunction in twofold reduction in HCD males and a 1.4-fold reduction
HCD-fed rats, consistent with our previous morphological in HCD females. Shao et al. further investigated the
studies, which confirmed fatty liver degeneration following molecular mechanisms of thyroid hormone synthesis and
13
prolonged HCD consumption. These findings align with showed that a high-fat diet downregulated the expression
established models of diet-induced visceral obesity and of thyroid transcription factor 1 and NIS, both of which
8
A B
Figure 5. TPO activity and MDA content in the thyroid tissue of experimental animals. TPO activity (A) and MDA content (B) in male and female rats.
Data are presented as mean ± standard deviation. Statistically significant differences: *p<0.05, **p<0.01 between male HCD and male control groups;
# p<0.05 between female HCD and female control groups.
Abbreviations: HCD: High-calorie diet; TPO: Thyroperoxidase; MDA: Malonic dialdehyde.
A B
Figure 6. Thyroid hormone levels in the serum of experimental animals. Serum levels of T4 (A) and T3 (B) in male and female rats. Data are presented as
mean ± standard deviation. Statistically significant differences: **p<0.01 between male HCD and male control groups; p<0.05 between female HCD and
#
female control groups.
Abbreviations: HCD: High-calorie diet; T4: Thyroxine; T3: Triiodothyronine.
Volume 4 Issue 2 (2025) 91 doi: 10.36922/GTM025080020