
Page 98 - GTM-4-2
P. 98
Global Translational Medicine Thyroid status in obesity
Table 1. Morphometric indices of thyroid tissue in experimental animals
Index Male rats Female rats
Control (n=13) HCD (n=14) Control (n=14) HCD (n=13)
Follicle area (μm ) 3694.67 (2629.37, 5529.83) 5566.28 (4039.65, 7748.07)**** 2513.43 (1737.55, 3932.96) 4355.28 (2677.50, 6265.74)####
2
Inner follicle diameter (μm) 44.30 (33.27, 56.00) 50.51 (36.27, 65.20)* 39.84 (32.62, 51.49) 54.41 (41.15, 74.41)####
Follicle epithelium height (μm) 7.52 (6.47, 8.32) 4.74 (4.28, 5.27)**** 6.63 (6.15, 7.18) 5.04 (4.65, 5.53)####
Colloid accumulation index 3.08 (2.34, 4.05) 5.17 (3.69, 7.07)**** 2.95 (2.54, 3.83) 5.58 (4.27, 7.25)####
Note: Data are presented as median (25 percentile, 75 percentile). Statistically significant differences: *p<0.05, ****p<0.0001 between male HCD and
th
th
male control groups; #### p<0.0001 between female HCD and female control groups.
Abbreviation: HCD: High-calorie diet.
Table 2. Biochemical indices of serum in experimental animals
Index Male rats Female rats
Control (n=13) HCD (n=14) Control (n=14) HCD (n=13)
Total bilirubin (μmol/L) 1.40 (1.20, 1.60) 2.40 (1.60, 3.00)** 2.30 (2.10, 2.90) 3.60 (2.40, 4.20)#
Aspartate aminotransferase (U/L) 196.00 (181.00, 217.00) 172.00 (146.00, 189.00)* 162.00 (144.00, 185.00) 159.00 (129.00, 164.00)
Alanine aminotransferase (U/L) 65.00 (62.00, 74.00) 57.50 (51.00, 68.00) 54.00 (43.00, 67.00) 36.00 (33.00, 41.00)##
Alkaline phosphatase (U/L) 373.00 (333.00, 423.00) 674.50 (371.00, 850.00)** 276.50 (219.00, 392.00) 496.00 (365.00, 661.00)###
Urea (mmol/L) 6.83 (6.45, 8.40) 4.35 (3.45, 4.77)**** 6.35 (5.83, 6.73) 3.66 (3.37, 4.21)####
Glucose (mmol/L) 5.81 (5.61, 7.37) 7.54 (7.10, 8.21)** 6.88 (6.07, 7.21) 7.80 (7.24, 8.03)#
Alpha amylase (U/L) 1508 (1426, 1712) 1940 (1788, 2124)*** 1556 (1418, 1748) 1758 (1580, 1860)#
Cholesterol (mmol/L) 1.43 (1.23, 1.61) 1.88 (1.50, 1.95)** 1.62 (1.47, 1.77) 1.67 (1.36, 1.90)
Triglycerides (mmol/L) 0.88 (0.63, 1.18) 1.18 (0.94, 2.21)* 1.37 (0.84, 1.80) 0.96 (0.66, 2.47)
th
th
Note: Data are presented as median (25 percentile, 75 percentile). Statistically significant differences: *p<0.05, **p<0.01, ***p<0.001, and
****p<0.0001 between male HCD and male control groups; p<0.05, p<0.01, p<0.001, and #### p<0.0001.
###
#
##
Abbreviation: HCD: High-calorie diet.
phosphatase activity (+79.4%, p<0.001), and total bilirubin
level (+56.5%, p=0.037).
Rats with HCD-induced visceral obesity also
showed abnormalities in carbohydrate metabolism and
pancreatic function. In relation to control animals, HCD
rats exhibited a statistically significant increase in serum
glucose concentration (male: 29.8%, p=0.003; female:
13.4%, p=0.047) and alpha-amylase activity (male: 28.6%,
p<0.001; female: 13.0%, p=0.036) (Table 2).
In male rats with HCD-induced visceral obesity, a
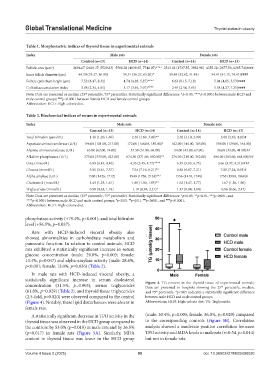
statistically significant increase in serum cholesterol Figure 4. TG content in the thyroid tissue of experimental animals.
concentration (31.5%, p=0.003), serum triglycerides Data are presented in boxplots showing the 25 percentile, median,
th
(61.8%, p=0.029) (Table 2), and thyroid tissue triglycerides and 75 percentile. *p<0.05 indicates a statistically significant difference
th
(2.5-fold, p=0.020) were observed compared to the control between male HCD and male control groups.
(Figure 4). Notably, these lipid disturbances were absent in Abbreviations: HCD: High-calorie diet; TG: Triglyceride.
female rats.
A statistically significant decrease in TPO activity in the (male: 30.4%, p=0.005; female: 36.0%, p=0.020) compared
thyroid tissue was observed in the HCD group compared to to the corresponding controls (Figure 5B). Correlation
the controls: by 53.0% (p=0.018) in male rats and by 26.5% analysis showed a moderate positive correlation between
(p=0.017) in female rats (Figure 5A). Similarly, MDA TPO activity and MDA levels in male rats (r=0.54, p=0.014)
content in thyroid tissue was lower in the HCD group but not in female rats.
Volume 4 Issue 2 (2025) 90 doi: 10.36922/GTM025080020