
Page 88 - IJAMD-1-1
P. 88
International Journal of AI
for Material and Design MMDB: A comprehensive biofabrication database
and institutional contributions for a specified time frame, plot indicates more frequent collaboration from a nation
ranging from 2012 to 2023. Furthermore, these results on a particular topic. The table below provides additional
can be refined using any of the 12 related terms generated details, such as the number of collaborations in each
by cluster algorithms, providing a thorough and focused topic and the top three major collaborative nations. The
analysis of research trends. cooperative institution sub-page links nations, institutions,
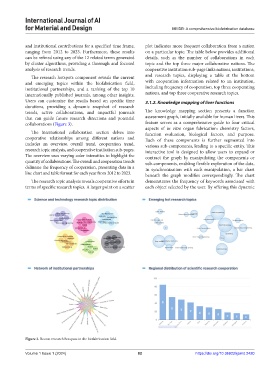
The research hotspots component reveals the current and research topics, displaying a table at the bottom
and emerging topics within the biofabrication field, with cooperation information related to an institution,
institutional partnerships, and a ranking of the top 10 including frequency of cooperation, top three cooperating
internationally published journals, among other insights. nations, and top three cooperative research topics.
Users can customize the results based on specific time 3.1.2. Knowledge mapping of liver functions
durations, providing a dynamic snapshot of research
trends, active collaborations, and impactful journals The knowledge mapping section presents a function
that can guide future research directions and potential assessment graph, initially available for human livers. This
collaborations (Figure 3). feature serves as a comprehensive guide to four critical
aspects of in vitro organ fabrication: chemistry factors,
The international collaboration section delves into function evaluation, biological factors, and purpose.
cooperative relationships among different nations and Each of these components is further segmented into
includes an overview, overall trend, cooperation trend, various sub-components, leading to a specific entity. This
research topic analysis, and cooperative institution sub-pages. interactive tool is designed to allow users to expand or
The overview uses varying color intensities to highlight the contract the graph by manipulating the components or
quantity of collaborations. The overall and cooperation trends sub-components, enabling flexible exploration of the data.
delineate the frequency of cooperation, presenting data in a In synchronization with each manipulation, a bar chart
line chart and table format for each year from 2012 to 2023. beneath the graph modifies correspondingly. The chart
The research topic analysis reveals cooperative efforts in demonstrates the frequency of keywords associated with
terms of specific research topics. A larger point on a scatter each object selected by the user. By offering this dynamic
Figure 3. Recent research hotspots in the biofabrication field.
Volume 1 Issue 1 (2024) 82 https://doi.org/10.36922/ijamd.2420