
Page 77 - IJAMD-2-2
P. 77
International Journal of AI for
Materials and Design Prediction of AM defect based on DL
the column of the scanning speed, there were 14 “1800”
values; nine “1700” values and “1900” values, respectively;
and five “600” values, “1000” values, “1400” values, and
“2200” values, respectively. From an AM perspective, the
scanning rotation degree has little effect on the LOF defect
formation, as it does not significantly influence energy
input. Therefore, the parameter of scanning rotation was
not considered in the DL analysis in this research. Because
there was unbalanced data in columns (with only 52 rows),
the dataset used in this paper was small and unbalanced. In
the column of LOF, “yes” was set to 1, and “no” was set to
0 for DL. There were thirty “1” values and twenty-two “0”
values. The experimental data were not originally prepared
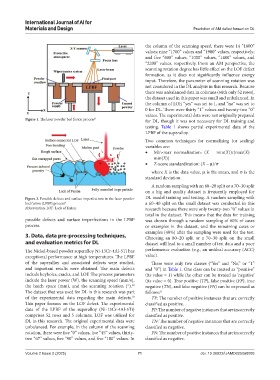
Figure 1. The laser powder bed fusion process 8 for DL, though it was not necessary for DL training and
testing. Table 1 shows partial experimental data of the
LPBF of the superalloy.
Two common techniques for normalizing (or scaling)
variables are:
• Min-max normalization: (X – min(X))/(max(X) –
min(X))
• Z-score standardization: (X – μ)/σ
where X is the data value, μ is the mean, and σ is the
standard deviation.
A random sampling with an 80–20 split or a 70–30 split
on a big and quality dataset is frequently employed for
Figure 2. Possible defects and surface imperfections in the laser powder DL model training and testing. A random sampling with
bed fusion (LPBF) process 9 a 60–40 split on the small dataset was conducted in this
Abbreviation: LOF: Lack of fusion. research because there were only twenty-two “0” values in
total in the dataset. This means that the data for training
possible defects and surface imperfections in the LPBF was chosen through a random sampling of 60% of cases
process. or examples in the dataset, and the remaining cases or
examples (40%) after the sampling were used for the test.
3. Data, data pre-processing techniques, Choosing an 80–20 split or a 70–30 split on the small
and evaluation metrics for DL dataset will lead to a small number of test data and a poor
The Nickel-based powder superalloy Ni-13Cr-4Al-5Ti has performance evaluation (e.g., an unideal accuracy (ACC)
exceptional performance at high temperatures. The LPBF value).
of the superalloy and associated defects were studied, There were only two classes (“Yes” and “No,” or “1”
and important results were obtained. The main defects and “0”) in Table 1. One class can be treated as “positive”
include keyholes, cracks, and LOF. The process parameters (its value = 1) while the other can be treated as ‘negative’
include the laser power (W), the scanning speed (mm/s), (its value = 0). True positive (TP), false positive (FP), true
the hatch space (mm), and the scanning rotation (°). 10 negative (TN), and false negative (FN) can be expressed as
The dataset that was used for DL in this research was part follows: 11
of the experimental data regarding the main defects. 10 TP: The number of positive instances that are correctly
This paper focuses on the LOF defect. The experimental classified as positive.
data of the LPBF of the superalloy (Ni-13Cr-4Al-5Ti) FP: The number of negative instances that are incorrectly
comprises 52 rows and 5 columns. LOF was utilized for classified as positive.
DL in this research. The original experimental data were TN: The number of negative instances that are correctly
unbalanced. For example, in the column of the scanning classified as negative.
rotation, there were five “0” values, five “45” values, thirty- FN: The number of positive instances that are incorrectly
two “67” values, five “90” values, and five “180” values. In classified as negative.
Volume 2 Issue 2 (2025) 71 doi: 10.36922/IJAMD025060005