
Page 80 - IJAMD-2-2
P. 80
International Journal of AI for
Materials and Design Prediction of AM defect based on DL
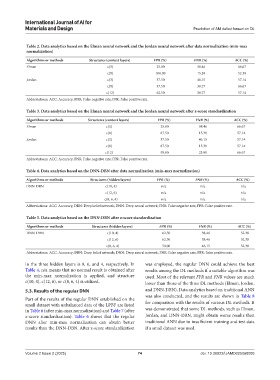
Table 2. Data analytics based on the Elman neural network and the Jordan neural network after data normalization (min‑max
normalization)
Algorithms or methods Structures (context layers) FPR (%) FNR (%) ACC (%)
Elman c(3) 25.00 38.46 66.67
c(8) 100.00 15.38 52.38
Jordan c(3) 37.50 46.15 57.14
c(8) 37.50 30.77 66.67
c(12) 62.50 30.77 57.14
Abbreviations: ACC: Accuracy; FNR: False negative rate; FPR: False positive rate.
Table 3. Data analytics based on the Elman neural network and the Jordan neural network after z‑score standardization
Algorithms or methods Structures (context layers) FPR (%) FNR (%) ACC (%)
Elman c(3) 25.00 38.46 66.67
c(8) 87.50 15.38 57.14
Jordan c(3) 37.50 46.15 57.14
c(8) 87.50 15.38 57.14
c(12) 50.00 23.08 66.67
Abbreviations: ACC: Accuracy; FNR: False negative rate; FPR: False positive rate.
Table 4. Data analytics based on the DNN‑DBN after data normalization (min‑max normalization)
Algorithms or methods Structures (hidden layers) FPR (%) FNR (%) ACC (%)
DNN-DBN c(10, 4) n/a n/a n/a
c(12, 6) n/a n/a n/a
c(8, 6, 4) n/a n/a n/a
Abbreviations: ACC: Accuracy; DBN: Deep belief network; DNN: Deep neural network; FNR: False negative rate; FPR: False positive rate.
Table 5. Data analytics based on the DNN‑DBN after z‑score standardization
Algorithms or methods Structures (hidden layers) FPR (%) FNR (%) ACC (%)
DNN-DBN c(10, 4) 62.50 38.46 52.38
c(12, 6) 62.50 38.46 52.38
c(8, 6, 4) 50.00 46.15 52.38
Abbreviations: ACC: Accuracy; DBN: Deep belief network; DNN: Deep neural network; FNR: False negative rate; FPR: False positive rate.
in the three hidden layers is 8, 6, and 4, respectively. In was employed, the regular DNN could achieve the best
Table 4, n/a means that no normal result is obtained after results among the DL methods if a suitable algorithm was
the min-max normalization is applied, and structure used. Most of the relevant FPR and FNR values are much
c(10, 4), c(12, 6), or c(8, 6, 4) is utilized. lower than those of the three DL methods (Elman, Jordan,
5.3. Results of the regular DNN and DNN-DBN). Data analytics based on traditional ANN
was also conducted, and the results are shown in Table 8
Part of the results of the regular DNN established on the
small dataset with unbalanced data of the LPBF are listed for comparison with the results of various DL methods. It
in Table 6 (after min-max normalization) and Table 7 (after was demonstrated that some DL methods, such as Elman,
z-score standardization). Table 6 shows that the regular Jordan, and DNN-DBN, might obtain worse results than
DNN after min-max normalization can obtain better traditional ANN due to insufficient training and test data
results than the DNN-DBN. After z-score standardization if a small dataset was used.
Volume 2 Issue 2 (2025) 74 doi: 10.36922/IJAMD025060005