
Page 90 - IJAMD-2-2
P. 90
International Journal of AI for
Materials and Design Fruit image detection using AI
is left unclassified by the system, thereby maximizing the Table 2. Confusion matrix for fruit classification
efficiency of the sorting process.
Fruit type Predicted Predicted Predicted
The F1 score balances the measure between precision tomato mango orange
and recall, further underscores the performance of a Actual tomato 85 10 5
model. Using combined features, an F1 score of 86.5% Actual mango 12 85 3
was observed, demonstrating an effective balance between Actual orange 8 2 90
precision and recall. This result highlights the robustness of
the classification framework and its suitability for reliable
fruit sorting.
In summary, the results show that the fruit classification
system performed significantly better when using a
comprehensive set of features. The findings underscore
the importance of effective feature selection in achieving
high accuracy, precision, recall, and F1 scores, all of which
contribute to a reliable and efficient automated fruit sorting
mechanism.
3.2. Confusion matrix for fruit classification
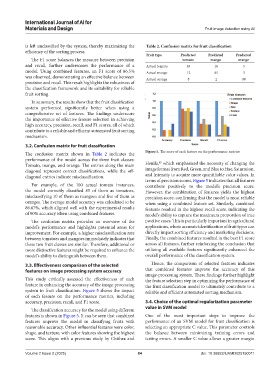
The confusion matrix shown in Table 2 indicates the Figure 5. The score of each feature on the performance metrics
performance of the model across the three fruit classes:
45
Tomato, mango, and orange. The entries along the main Henila, which emphasized the necessity of changing the
diagonal represent correct classifications, while the off- image format from Red, Green, and Blue to Hue, Saturation,
diagonal entries indicate misclassification. and Intensity to acquire more quantifiable color values. In
terms of precision scores, Figure 5 indicates that all features
For example, of the 100 actual tomato instances, contribute positively to the model’s precision score.
the model correctly classified 85 of them as tomatoes, However, the combination of features yields the highest
misclassifying 10 of them as mangoes and five of them as precision score, confirming that the model is most reliable
oranges. The average model accuracy was calculated to be when using a combined feature set. Similarly, combined
86.67%, which aligned well with the experimental results features resulted in the highest recall score, indicating the
of 90% accuracy when using combined features. model’s ability to capture the maximum proportion of true
The confusion matrix provides an overview of the positive cases. This is particularly important in agricultural
model’s performance and highlights potential areas for applications, where accurate identification of fruit types can
improvement. For example, a higher misclassification rate directly impact sorting efficiency and marketing decisions.
between tomatoes and mangoes immediately indicates that Finally, the combined features resulted in the best F1 score
these two fruit classes are similar. Therefore, additional or across all features, further reinforcing the conclusion that
more distinctive features might be required to enhance the utilizing all available features significantly enhanced the
model’s ability to distinguish between them. overall performance of the classification system.
3.3. Effectiveness comparison of the selected Hence, the comparison of selected features indicates
features on image processing system accuracy that combined features improve the accuracy of this
image-processing system. These findings further highlight
This study critically assessed the effectiveness of each the feature selection step in optimizing the performance of
feature in enhancing the accuracy of the image processing the fruit classification model to ultimately contribute to a
system in fruit classification. Figure 5 shows the impact reliable and efficient automated sorting mechanism.
of each feature on the performance metrics, including
accuracy, precision, recall, and F1 score. 3.4. Choice of the optimal regularization parameter
The classification accuracy for the model using different value in SVM model
features is shown in Figure 5. It can be seen that combined One of the most important steps to improve the
features improve the model in classifying fruits with performance of an SVM model for fruit classification is
reasonable accuracy. Other influential features were color, selecting an appropriate C value. This parameter controls
shape, and texture, with color features showing the highest the balance between minimizing training errors and
score. This aligns with a previous study by Chithra and testing errors. A smaller C value allows a greater margin
Volume 2 Issue 2 (2025) 84 doi: 10.36922/IJAMD025150011