
Page 91 - IJAMD-2-2
P. 91
International Journal of AI for
Materials and Design Fruit image detection using AI
of error, which may lead to more misclassifications. In
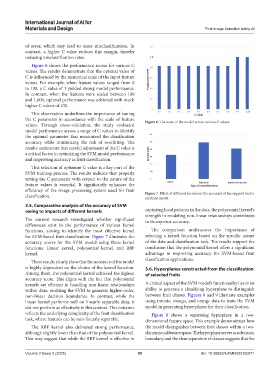
contrast, a higher C value reduces this margin, thereby
reducing misclassification rates.
Figure 6 shows the performance scores for various C
values. The results demonstrate that the optimal value of
C is influenced by the numerical scale of the input feature
values. For example, when feature values ranged from 0
to 100, a C value of 1 yielded strong model performance.
In contrast, when the features were scaled between 100
and 1,000, optimal performance was achieved with much
higher C values of 100.
This observation underlines the importance of tuning
the C parameter in accordance with the scale of feature Figure 6. The score of the model across various C values
values. Through cross-validation, the study evaluated
model performance across a range of C values to identify
the optimal parameter that maximized the classification
accuracy while minimizing the risk of overfitting. The
results underscore that careful adjustment of the C value is
a critical factor in optimizing the SVM model performance
and improving accuracy in fruit classification.
This selection of optimum C value is a key part of the
SVM training process. The results indicate that properly
setting the C parameter with respect to the nature of the
feature values is essential. It significantly enhances the
efficiency of the image processing system used for fruit
classification. Figure 7. Effect of different kernels on the accuracy of the support vector
machine model
3.5. Comparative analysis of the accuracy of SVM
owing to impacts of different kernels capturing local patterns in the data, the polynomial kernel’s
strength in modeling non-linear relationships contributes
The current research investigated whether significant to its superior accuracy.
differences exist in the performance of various kernel
functions, aiming to identify the most effective kernel The comparison underscores the importance of
for SVM-based fruit classification. Figure 7 illustrates the selecting a kernel function based on the specific nature
accuracy scores for the SVM model using three kernel of the data and classification task. The results support the
functions: Linear kernel, polynomial kernel, and RBF conclusion that the polynomial kernel offers a significant
kernel. advantage in improving accuracy for SVM-based fruit
classification applications.
These results clearly show that the accuracy of the model
is highly dependent on the choice of the kernel function. 3.6. Hyperplanes constructed from the classification
Among them, the polynomial kernel achieved the highest of selected fruits
accuracy score. This aligns with the fact that polynomial
kernels are efficient in handling non-linear relationships A critical aspect of the SVM model’s functionality lies in its
within data, enabling the SVM to generate higher-order, ability to generate a classifying hyperplane to distinguish
non-linear decision boundaries. In contrast, while the between fruit classes. Figures 8 and 9 illustrate examples
linear kernel performs well on linearly separable data, it using tomato, mango, and orange data to train the SVM
did not perform as effectively in this context. This outcome model in generating hyperplanes for their classification.
reflects the underlying complexity of the fruit classification Figure 8 shows a separating hyperplane in a two-
task, where features can be non-linearly separable. dimensional feature space. This example demonstrates how
The RBF kernel also delivered strong performance, the model distinguishes between fruit classes within a two-
although slightly lower than that of the polynomial kernel. dimensional feature space. The hyperplane serves as a decision
This may suggest that while the RBF kernel is effective in boundary, and the clear separation of classes suggests that the
Volume 2 Issue 2 (2025) 85 doi: 10.36922/IJAMD025150011