
Page 357 - IJB-10-1
P. 357
International Journal of Bioprinting Corrosion behavior of SLM-prepared 316L steel
in the substructure of sample 17, and the occurrence curves) acquired during testing of the swaged samples, and
of dislocation tangles and dislocation cells within the in Table 3, which summarizes the characteristic values
substructure (there are many dislocations but lesser resulting from Tafel extrapolations. The comparison of the
subgrains). The energy imparted by continuing swaging, I parameter, i.e., the corrosion current density (in µA/
corr
i.e., the increased imposed shear strain, contributed to cm ), shows that sample 17 acquired the greatest corrosion
2
structure restoration, i.e., annihilation of the majority resistance among the examined swaged samples 20, 17,
of the dislocations, and the formation of numerous and 15. This was confirmed also by calculating corrosion
subgrains for sample 15. Figure 6E depicts the presence rate (CR, in mm/year; see Table 3). During the swaging
of a relatively inhomogeneous substructure (from the procedure, the CR decreased after swaging from the
viewpoint of dislocations density) consisting of grains diameter of 20 mm to 17 mm, and then slightly increased
with low and high dislocations densities, and Figure 6F after swaging to 15 mm. We also found the results of the
shows a detailed image of subgrains formed within the pitting corrosion analyses intriguing; the E parameter
pit
substructure of the sample 15. stands for the critical pitting potential, which is the least
positive potential at which the pits form. Table 2 shows that
3.5. Electrochemical corrosion this parameter was also the most favorable for sample 17,
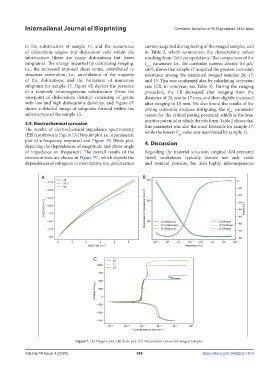
The results of electrochemical impedance spectrometry while the lowest E value was manifested by sample 15.
(EIS) are shown in Figure 7A (Nyquist plot, i.e., a parametric pit
plot of a frequency response) and Figure 7B (Bode plot, 4. Discussion
depicting the dependences of magnitude and phase angle
of impedance on frequency). The overall results of the Regarding the material structure, original AM-prepared
corrosion tests are shown in Figure 7C, which depicts the (steel) workpieces typically feature not only voids
dependences of voltage on current density (i.e., polarization and residual porosity, but also highly inhomogeneous
Figure 7. (A) Nyquist plot. (B) Bode plot. (C) Polarization curves for swaged samples.
Volume 10 Issue 1 (2024) 349 https://doi.org/10.36922/ijb.1416