
Page 85 - IJB-2-2
P. 85
Kuppuswamy Hariharan and Ganesan Arumaikkannu
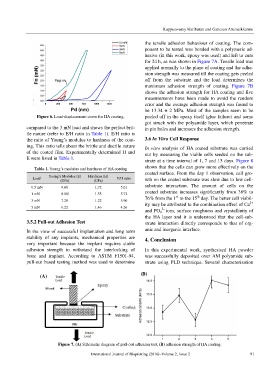
the tensile adhesion behaviour of coating. The com-
ponent to be tested was bonded with a polymeric ad-
hesive (in this work, epoxy was used) and left to cure
for 24 h, as was shown in Figure 7A. Tensile load was
applied normally to the plane of coating and the adhe-
sion strength was measured till the coating gets peeled
off from the substrate and the load determines the
maximum adhesion strength of coating. Figure 7B
shows the adhesion strength for HA coating and five
measurements have been made to avoid the random
error and the average adhesion strength was found to
be 13.34 ± 2 MPa. Most of the samples seem to be
Figure 6. Load-displacement curve for HA coating. peeled off in the epoxy itself (glue failure) and some
got struck with the polyamide layer, which penetrate
compared to the 3 mN load and shows the perfect brit- in pin holes and increases the adhesion strength.
tle nature (refer to E/H ratio in Table 1). E/H ratio is
the ratio of Young’s modulus to hardness of the coat- 3.6 In Vitro Cell Response
ing. This ratio tells about the brittle and ductile nature In vitro analysis of HA coated substrate was carried
of the coated film. Experimentally determined H and out by measuring the viable cells seeded on the sub-
E were listed in Table 1. strate at a time interval of 1, 7 and 15 days. Figure 8
Table 1. Young’s modulus and hardness of HA coating shows that the cells can grow more effectively on the
coated surface. From the day 1 observation, cell gro-
Load Young’s Modulus (E) Hardness (H) E/H ratio
(GPa) (GPa) wth on the coated substrate was slow due to low cell-
0.5 mN 9.66 1.72 5.61 substrate interaction. The amount of cells on the
1 mN 8.881 1.55 5.72 coated substrate increases significantly from 38% to
st
th
3 mN 7.28 1.22 5.96 76% from the 1 to the 15 day. The better cell viabil-
2+
5 mN 6.22 1.46 4.26 ity may be attributed to the combination effect of Ca
3–
and PO 4 ions, surface roughness and crystallinity of
the HA layer and it is understood that the cell-sub-
3.5.2 Pull-out Adhesion Test strate interaction directly corresponds to that of org-
In the view of successful implantation and long term anic and inorganic interface.
stability of any implants, mechanical properties are 4. Conclusion
very important because the implant requires stable
adhesion strength to withstand the interlocking of In this experimental work, synthesised HA powder
bone and implant. According to ASTM F1501-94, was successfully deposited over AM polyamide sub-
pull-out based testing method was used to determine strate using PLD technique. Several characterisation
(A) (B)
Figure 7. (A) Schematic diagram of pull-out adhesion test, (B) adhesion strength of HA coating.
International Journal of Bioprinting (2016)–Volume 2, Issue 2 91