
Page 84 - IJB-2-2
P. 84
Structural, mechanical and in vitro studies on pulsed laser deposition of hydroxyapatite on additive manufactured polyamide substrate
(A) (B)
Figure 3. AFM image of HA layer. (A) 5 × 5 µm scanning area; (B) 10 ×10 µm scanning area.
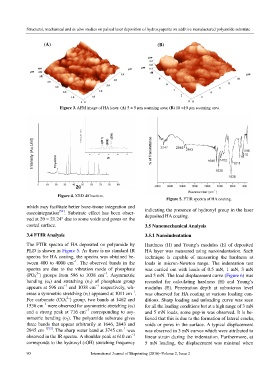
Figure 4. XRD diffraction.
Figure 5. FTIR spectra of HA coating.
which may facilitate better bone-tissue integration and
osseointegration [52] . Substrate effect has been obser- indicating the presence of hydroxyl group in the laser
ved at 2θ = 21.24° due to some voids and pores on the deposited HA coating.
coated surface. 3.5 Nanomechanical Analysis
3.4 FTIR Analysis 3.5.1 Nanoindentation
The FTIR spectra of HA deposited on polyamide by Hardness (H) and Young’s modulus (E) of deposited
PLD is shown in Figure 5. As there is no standard IR HA layer was measured using nanoindentation. Such
spectra for HA coating, the spectra was obtained be- technique is capable of measuring the hardness at
–1
tween 400 to 4000 cm . The observed bands in the loads in micron-Newton range. The indentation test
spectra are due to the vibration mode of phosphate was carried out with loads of 0.5 mN, 1 mN, 3 mN
3–
–1
(PO 4 ) groups from 596 to 1038 cm . Asymmetric and 5 mN. The load displacement curve (Figure 6) was
bending (ʋ 4) and stretching (ʋ 3) of phosphate group recorded for calculating hardness (H) and Young’s
–1
–1
appears at 596 cm and 1038 cm respectively, wh- modulus (E). Penetration depth at submicron level
–1
ereas a symmetric stretching (ʋ 1) appeared at 1011 cm . was observed for HA coating at various loading con-
2–
For carbonate (CO 3 ) group, two bands at 1462 and ditions. Sharp loading and unloading curve was seen
–1
1536 cm were observed for asymmetric stretching (ʋ 3) for all the loading conditions but at a high range of 3 mN
–1
and a strong peak at 716 cm corresponding to asy- and 5 mN loads, some pop-in was observed. It is be-
mmetric bending (ʋ 2). The polyamide substrate gives lieved that this is due to the formation of lateral cracks,
three bands that appear arbitrarily at 1646, 2843 and voids or pores in the surface. A typical displacement
–1
2945 cm –1[53] . The sharp water band at 3745 cm was was observed in 3 mN curves which were attributed to
–1
observed in the IR spectra. A shoulder peak at 610 cm linear strain during the indentation. Furthermore, at
corresponds to the hydroxyl (-OH) stretching frequency 5 mN loading, the displacement was minimal when
90 International Journal of Bioprinting (2016)–Volume 2, Issue 2