
Page 83 - IJB-2-2
P. 83
Kuppuswamy Hariharan and Ganesan Arumaikkannu
(B)
(A)
(C)
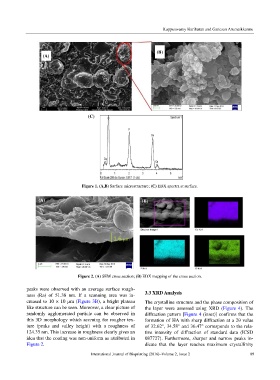
Figure 1. (A,B) Surface microstructure; (C) EDX spectra at surface.
(A) (B)
Figure 2. (A) SEM cross section; (B) EDX mapping of the cross section.
peaks were observed with an average surface rough-
ness (Ra) of 51.38 nm. If a scanning area was in- 3.3 XRD Analysis
creased to 10 × 10 µm (Figure 3B), a bright plateau The crystalline structure and the phase composition of
like structure can be seen. Moreover, a clear picture of the layer were assessed using XRD (Figure 4). The
randomly agglomerated particle can be observed in diffraction pattern [Figure 4 (inset)] confirms that the
this 3D morphology which accruing for rougher tex- formation of HA with sharp diffraction at a 2θ value
ture (peaks and valley height) with a roughness of of 32.62°, 34.58° and 36.47° corresponds to the rela-
124.35 nm. This increase in roughness clearly gives an tive intensity of diffraction of standard data (ICSD
idea that the coating was non-uniform as attributed in 087727). Furthermore, sharper and narrow peaks in-
Figure 2. dicate that the layer reaches maximum crystallinity
International Journal of Bioprinting (2016)–Volume 2, Issue 2 89