
Page 277 - IJB-10-2
P. 277
International Journal of Bioprinting Microfluidic spinning for neural models
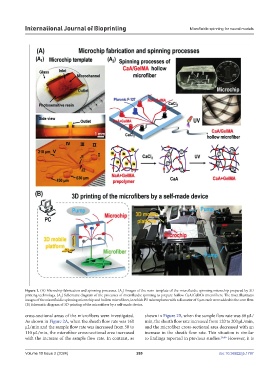
Figure 1. (A) Microchip fabrication and spinning processes. (A ) Images of the resin template of the microfluidic spinning microchip prepared by 3D
1
printing technology. (A ) Schematic diagram of the processes of microfluidic spinning to prepare hollow CaA/GelMA microfibers. The inset illustrates
2
images of the microfluidic spinning microchip and hollow microfibers, in which PS microspheres with a diameter of 5 μm each were added to the core flow.
(B) Schematic diagram of 3D printing of the microfibers by a self-made device.
cross-sectional areas of the microfibers were investigated. shown in Figure 2B, when the sample flow rate was 80 μL/
As shown in Figure 2A, when the sheath flow rate was 160 min, the sheath flow rate increased from 120 to 200 μL/min,
μL/min and the sample flow rate was increased from 50 to and the microfiber cross-sectional area decreased with an
110 μL/min, the microfiber cross-sectional area increased increase in the sheath flow rate. This situation is similar
with the increase of the sample flow rate. In contrast, as to findings reported in previous studies. 26,46 However, it is
Volume 10 Issue 2 (2024) 269 doi: 10.36922/ijb.1797