
Page 278 - IJB-10-2
P. 278
International Journal of Bioprinting Microfluidic spinning for neural models
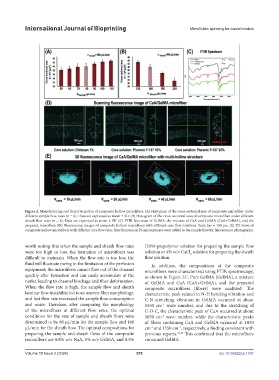
Figure 2. Manufacturing and characterization of composite hollow microfibers. (A) Histogram of the cross-sectional area of composite microfiber under
different sample flow rates (n = 6). Data are expressed as mean ± SD. (B) Histogram of the cross-sectional area of composite microfiber under different
sheath flow rates (n = 6). Data are expressed as mean ± SD. (C) FTIR Spectrum of GelMA, the mixture of CaA and GelMA (CaA+GelMA), and the
prepared microfiber. (D) Fluorescence images of composite hollow microfibers with different core flow solutions. Scale bar = 100 µm. (E) 3D views of
composite hollow microfibers with different core flow rates. Blue fluorescent PS microspheres were added to the sample flow for fluorescence photography.
worth noting that when the sample and sheath flow rates I2959 prepolymer solution for preparing the sample flow
were too high or low, the formation of microfibers was solution or 4% w/v CaCl solution for preparing the sheath
2
difficult to maintain. When the flow rate is too low, the flow solution.
fluid will fluctuate owing to the limitation of the perfusion In addition, the compositions of the composite
equipment; the microfibers cannot flow out of the channel microfibers were characterized using FTIR spectroscopy,
quickly after formation and can easily accumulate at the as shown in Figure 2C. Pure GelMA (GelMA), a mixture
outlet, leading to channel blockage and fiber deformation. of GelMA and CaA (CaA+GelMA), and the prepared
When the flow rate is high, the sample flow and sheath composite microfibers (fibers) were analyzed. The
laminar flow instability led to an uneven fiber morphology, characteristic peak related to N-H bending vibration and
and fast flow rate increased the sample flow consumption C-N stretching vibration in GelMA occurred at about
and waste. Therefore, after comparing the morphology 1550 cm wave number, and due to the stretching of
-1
of the microfibers at different flow rates, the optimal C-O-C, the characteristic peak of CaA occurred at about
conditions for the rate of sample and sheath flows were 1030 cm wave number, while the characteristic peaks
-1
determined to be 80 μL/min for the sample flow and 160 of fibers containing CaA and GelMA occurred at 1030
μL/min for the sheath flow. The optimal compositions for cm and 1550 cm , respectively, a finding consistent with
-1
-1
preparing the sample and sheath flows of the composite previous reports. 26,47 This confirmed that the microfibers
microfibers are 0.8% w/v NaA, 5% w/v GelMA, and 0.5% contained GelMA.
Volume 10 Issue 2 (2024) 270 doi: 10.36922/ijb.1797