
Page 283 - IJB-10-2
P. 283
International Journal of Bioprinting Microfluidic spinning for neural models
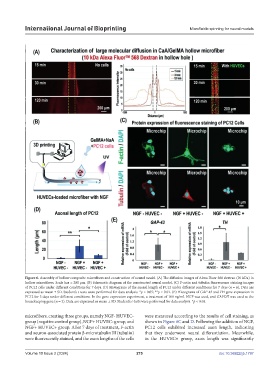
Figure 6. Assembly of hollow composite microfibers and construction of neural model. (A) The diffusion images of Alexa Fluor 568 dextran (10 kDa) in
hollow microfibers. Scale bar = 200 µm. (B) Schematic diagram of the constructed neural model. (C) F-actin and tubulin fluorescence staining images
of PC12 cells under different conditions for 7 days. (D) Histograms of the axonal length of PC12 under different conditions for 7 days (n = 6). Data are
expressed as mean ± SD. Student’s t-tests were performed for data analysis. *p < 0.05; **p < 0.01. (E) Histograms of GAP-43 and TH gene expression in
PC12 for 3 days under different conditions. In the gene expression experiment, a treatment of 100 ng/mL NGF was used, and GAPDH was used as the
housekeeping gene (n = 3). Data are expressed as mean ± SD. Student’s t-tests were performed for data analysis. *p < 0.05.
microfibers, creating three groups, namely NGF- HUVEC- were measured according to the results of cell staining, as
group (negative control group), NGF+ HUVEC- group, and shown in Figure 6C and D. Following the addition of NGF,
NGF+ HUVEC+ group. After 7 days of treatment, F-actin PC12 cells exhibited increased axon length, indicating
and neuron-associated protein β-microtubulin III (tubulin) that they underwent neural differentiation. Meanwhile,
were fluorescently stained, and the axon lengths of the cells in the HUVEC+ group, axon length was significantly
Volume 10 Issue 2 (2024) 275 doi: 10.36922/ijb.1797