
Page 326 - IJB-10-2
P. 326
International Journal of Bioprinting Continuous gradient TPMS bone scaffold
increase in the stress–strain curve after entering the yield
stage. Due to the structural characteristics of the unit cell,
the stress curve of the P surface fluctuates after entering
the yield stage.
It can be observed from Figure 7c and d that the elastic
modulus of the G surface initially increases and then
decreases with an increase in periodic parameters. On
the other hand, the P surface always shows an increasing
trend. Further validation of the mechanical properties
difference between the two structures will be conducted
through experiments.
Figure 8 represents the stress–strain curve obtained
from static compression experiments performed on the two
structures. The figure demonstrates that the trend of the
stress–strain curve aligns with the simulation results, thus
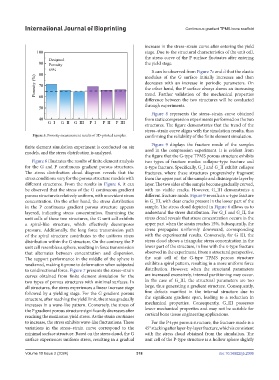
Figure 5. Porosity measurement results of 3D-printed samples. confirming the reliability of the finite element simulation.
Figure 9 displays the fracture mode of the samples
finite element simulation experiment is conducted on six
models, and the stress distribution is analyzed. used in the compression experiment. It is evident from
the figure that the G-type TPMS porous structure exhibits
Figure 6 illustrates the results of finite element analysis two types of fracture modes: collapse-type fracture and
for the G and P continuous gradient porous structures. x-type fracture. Specifically, G_I and G_II exhibit collapse
The stress distribution cloud diagram reveals that the fractures, where these structures progressively fragment
stress conditions vary for the porous structure models with from the upper part of the sample and disintegrate layer by
different structures. From the results in Figure 6, it can layer. The two sides of the sample become gradually curved,
be observed that the stress of the G continuous gradient with no visible cracks. However, G_III demonstrates a
porous structure is relatively uniform, with no evident stress different fracture mode. Figure 9 reveals an x-type fracture
concentration. On the other hand, the stress distribution in G_III, with clear cracks present in the lower part of the
in the P continuous gradient porous structure appears sample. The stress cloud depicted in Figure 6 allows us to
layered, indicating stress concentration. Examining the understand the stress distribution. For G_I and G_II, the
unit cells of these two structures, the G unit cell exhibits stress cloud reveals that stress concentration occurs in the
a spiral-like structure, which effectively decomposes upper part when the strain reaches 15%. Subsequently, the
pressure. Additionally, the long force transmission path stress propagates uniformly downward, corresponding
of the spiral structure contributes to the uniform stress with the experimental results. Conversely, for G_III, the
distribution within the G structure. On the contrary, the P stress cloud shows a triangular stress concentration in the
unit cell resembles a sphere, resulting in force transmission lower part of the structure, in line with the x-type fracture
that alternates between concentration and dispersion. observed in the experiment. From a structural perspective,
The support performance in the middle of the sphere is the unit cell of the G-type TPMS porous structure
weakened, making it prone to deformation when subjected exhibits a spiral pattern, resulting in a more uniform force
to unidirectional force. Figure 7 presents the stress–strain distribution. However, when the structural parameters
curves obtained from finite element simulation for the are increased excessively, internal partitioning may occur.
two types of porous structures with minimal surfaces. In In the case of G_III, the structural parameters are too
all structures, the stress experiences a linear increase stage large, thus generating a gradient structure. Consequently,
followed by a yielding stage. For the G gradient porous fine defects manifest in the internal structure due to
structure, after reaching the yield limit, the stress gradually the significant gradient span, leading to a reduction in
increases in a wave-like pattern. Conversely, the stress of mechanical properties. Consequently, G_III possesses
the P gradient porous structure significantly decreases after lower mechanical properties and may not be suitable for
reaching the maximum yield stress. As the strain continues cortical bone tissue engineering applications.
to increase, the stress exhibits wave-like fluctuations. These For the P-type porous structure, the fracture mode is a
variations in the stress–strain curve correspond to the 45° stacking after layer-by-layer fracture, which is consistent
minimal surface structure. Based on the stress cloud, the G with the stress cloud obtained from the simulation. The
surface experiences uniform stress, resulting in a gradual unit cell of the P-type structure is a hollow sphere slightly
Volume 10 Issue 2 (2024) 318 doi: 10.36922/ijb.2306