
Page 445 - IJB-10-2
P. 445
International Journal of Bioprinting 3D-printed silicon nitride-PEEK implants
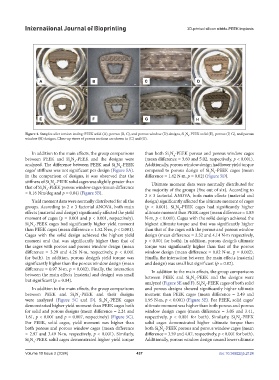
Figure 4. Samples after torsion testing: PEEK solid (A), porous (B, C), and porous window (D) designs, Si N -PEEK solid (E), porous (F, G), and porous
4
3
window (H) designs. Close-up views of porous sections are shown in (C) and (G).
In addition to the main effects, the group comparisons than both Si N -PEEK porous and porous window cages
4
3
between PEEK and Si N -PEEK and the designs were (mean difference = 3.60 and 5.02, respectively, p < 0.001).
3
4
analyzed. The difference between PEEK and Si N -PEEK Additionally, porous window design had lower yield torque
3
4
cages’ stiffness was not significant per design (Figure 5A). compared to porous design of Si N -PEEK cages (mean
3
4
In the comparison of designs, it was observed that the difference = 1.42 N·m, p = 0.02) (Figure 5D).
stiffness of Si N -PEEK solid cages was slightly greater than Ultimate moment data were normally distributed for
4
3
that of Si N -PEEK porous window cages (mean difference the majority of the groups (five out of six). According to
4
3
= 0.16 Nm/deg and p = 0.04) (Figure 5B).
2 × 3 factorial ANOVA, both main effects (material and
Yield moment data were normally distributed for all the design) significantly affected the ultimate moment of cages
groups. According to 2 × 3 factorial ANOVA, both main (p < 0.001). Si N -PEEK cages had significantly higher
4
3
effects (material and design) significantly affected the yield ultimate moment than PEEK cages (mean difference = 1.83
moment of cages (p = 0.001 and p < 0.001, respectively). N·m, p < 0.001). Cages with the solid design achieved the
Si N -PEEK cages had significantly higher yield moment highest ultimate torque and that was significantly higher
4
3
than PEEK cages (mean difference = 1.52 N·m, p < 0.001). than that of the cages with the porous and porous window
Cages with the solid design achieved the highest yield design (mean difference = 3.32 and 4.14 N·m respectively,
moment and that was significantly higher than that of p < 0.001 for both). In addition, porous design’s ultimate
the cages with porous and porous window design (mean torque was significantly higher than that of the porous
difference = 3.29 and 4.26 N·m, respectively, p < 0.001 window design (mean difference = 0.82 N·m, p = 0.002).
for both). In addition, porous design’s yield torque was Finally, the interaction between the main effects (material
significantly higher than the porous window design (mean and design) was small but significant (p = 0.02).
difference = 0.97 N·m, p = 0.002). Finally, the interaction In addition to the main effects, the group comparisons
between the main effects (material and design) was small between PEEK and Si N -PEEK and the designs were
but significant (p = 0.04). 3 4
analyzed (Figure 5E and F). Si N -PEEK cages of both solid
3
4
In addition to the main effects, the group comparisons and porous designs showed significantly higher ultimate
between PEEK and Si N -PEEK and their designs moment than PEEK cages (mean difference = 2.49 and
4
3
were analyzed (Figure 5C and D). Si N -PEEK cages 1.95 N·m, p < 0.001) (Figure 5E). For PEEK, solid cages’
4
3
demonstrated higher yield moment than PEEK cages both ultimate moment was higher than both porous and porous
for solid and porous designs (mean difference = 2.24 and window design cages (mean difference = 3.05 and 3.41,
1.61, p < 0.001 and p = 0.007, respectively) (Figure 5C). respectively, p < 0.001 for both). Similarly, Si N -PEEK
4
3
For PEEK, solid cages, yield moment was higher than solid cages demonstrated higher ultimate torque than
both porous and porous window cages (mean difference both Si N -PEEK porous and porous window cages (mean
4
3
= 2.97 and 3.49 N·m, respectively, p < 0.001). Similarly, difference = 3.59 and 4.87, respectively, p < 0.001 for both).
Si N -PEEK solid cages demonstrated higher yield torque Additionally, porous window design caused lower ultimate
4
3
Volume 10 Issue 2 (2024) 437 doi: 10.36922/ijb.2124