
Page 447 - IJB-10-2
P. 447
International Journal of Bioprinting 3D-printed silicon nitride-PEEK implants
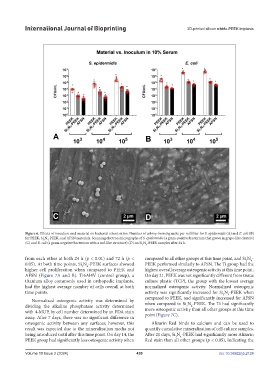
Figure 6. Effects of inoculum and material on bacterial colonization. Number of colony-forming units per milliliter for S. epidermidis (A) and E. coli (B)
for PEEK, Si N -PEEK, and AFSN materials. Scanning electron micrographs of S. epidermidis (a gram-positive bacterium that grows in grape-like clusters)
4
3
(C) and E. coli (a gram-negative bacterium with a rod-like structure) (D) on Si N -PEEK samples after 24 h.
4
3
from each other at both 24 h (p < 0.01) and 72 h (p < compared to all other groups at this time point, and Si N -
4
3
0.05). At both time points, Si N -PEEK surfaces showed PEEK performed similarly to AFSN. The Ti group had the
3
4
higher cell proliferation when compared to PEEK and highest overall average osteogenic activity at this time point.
AFSN (Figure 7A and B). Ti6Al4V (control group), a On day 21, PEEK was not significantly different from tissue
titanium alloy commonly used in orthopedic implants, culture plastic (TCP), the group with the lowest average
had the highest average number of cells overall at both normalized osteogenic activity. Normalized osteogenic
time points. activity was significantly increased for Si N -PEEK when
3
4
compared to PEEK, and significantly increased for AFSN
Normalized osteogenic activity was determined by
dividing the alkaline phosphatase activity determined when compared to Si N -PEEK. The Ti had significantly
4
3
more osteogenic activity than all other groups at this time
with 4-MUP, by cell number determined by an FDA stain point (Figure 7C).
assay. After 7 days, there was no significant difference in
osteogenic activity between any surfaces; however, this Alizarin Red binds to calcium and can be used to
result was expected due to the mineralization media not quantify cumulative mineralization of cell culture samples.
being introduced until after this time point. On day 14, the After 21 days, Si N -PEEK had significantly more Alizarin
3
4
PEEK group had significantly less osteogenic activity when Red stain than all other groups (p < 0.05), indicating the
Volume 10 Issue 2 (2024) 439 doi: 10.36922/ijb.2124