
Page 53 - IJB-3-1
P. 53
Lothar Koch, Ole Brandt, Andrea Deiwick, et al.
(C)
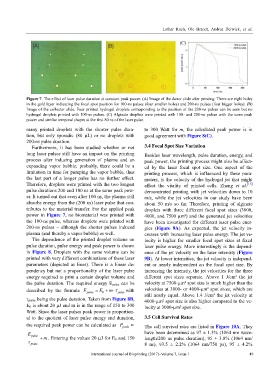
Figure 7. The effect of laser pulse duration at constant peak power. (A) Image of the donor slide after printing: There are eight holes
in the gold layer indicating the focal spot position for 100-ns pulses (four smaller holes) and 200-ns pulses (four bigger holes). (B)
Image of the collector slide. Four printed hydrogel droplets corresponding to the position of the 200-ns pulses can be seen but no
hydrogel droplets printed with 100-ns pulses. (C) Alginate droplets were printed with 100- and 200-ns pulses with the same peak
power and similar temporal shapes at the first 80 ns of the laser pulse.
many printed droplets with the shorter pulse dura- to 300 Watt for m, the calculated peak power is in
tion, but only sporadic (80 µL) or no droplets with good agreement with Figure 8(C).
200-ns pulse duration.
Furthermore, it has been studied whether or not 3.4 Focal Spot Size Variation
long laser pulses still have an impact on the printing Besides laser wavelength, pulse duration, energy, and
process after inducing generation of plasma and an peak power, the printing process might also be affect-
expanding vapor bubble; probably, there could be a ed by the laser focal spot size. One aspect of the
limitation in time for pumping the vapor bubble, thus printing process, which is influenced by these para-
the last part of a longer pulse has no further effect. meters, is the velocity of the hydrogel jet that might
Therefore, droplets were printed with the two longest affect the vitality of printed cells. Zhang et al. [16]
pulse durations 200 and 100 ns at the same peak pow- demonstrated printing with jet velocities down to 10
er. It turned out that even after 100 ns, the plasma still m/s, while the jet velocities in our study have been
absorbs energy from the (200 ns) laser pulse that con- about 50 m/s so far. Therefore, printing of alginate
tributes to the material transfer. For the applied peak droplets with three different focal spot sizes (3000,
power in Figure 7, no biomaterial was printed with 4000, and 7500 µm²) and the generated jet velocities
the 100-ns pulse, whereas droplets were printed with have been investigated for different laser pulse ener-
200-ns pulses – although the shorter pulses induced gies (Figure 9A). As expected, the jet velocity in-
plasma (and thereby a vapor bubble) as well. creases with increasing laser pulse energy. The jet ve-
The dependence of the printed droplet volume on locity is higher for smaller focal spot sizes at fixed
pulse duration, pulse energy and peak power is shown laser pulse energy. More interestingly is the depend-
in Figure 8. Droplets with the same volume can be ence of the jet velocity on the laser intensity (Figure
printed with very different combinations of these laser 9B). At lower intensities, the jet velocity is independ-
parameters (depicted as lines). There is a linear de- ent or nearly independent on the focal spot size. By
pendency but not a proportionality of the laser pulse increasing the intensity, the jet velocities for the three
energy required to print a certain droplet volume and different spot sizes separate. Above 1 J/cm² the jet
the pulse duration. The required energy E pulse can be velocity at 7500-µm² spot size is much higher than the
described by the formula E pulse E m pulse with velocities at 3000- or 4000-µm² spot sizes, which are
0
pulse being the pulse duration. Taken from Figure 8B, still nearly equal. Above 1.4 J/cm² the jet velocity at
4000-µm² spot size is also higher compared to the ve-
E 0 is about 20 µJ and m is in the range of 150 to 300 locity at 3000-µm² spot size.
Watt. Since the laser pulses peak power is proportion-
al to the quotient of laser pulse energy and duration, 3.5 Cell Survival Rates
the required peak power can be calculated as P peak The cell survival rates are listed in Figure 10A. They
E pulse have been determined as 97 ± 1.5% (1064 nm wave-
pulse m . Entering the values 20 µJ for E 0 and 150 length/200 ns pulse duration), 95 ± 3.8% (1064 nm/
8 ns), 93.5 ± 2.2% (1064 nm/750 ps), 95 ± 4.2%
International Journal of Bioprinting (2017)–Volume 3, Issue 1 49