
Page 51 - IJB-3-1
P. 51
Lothar Koch, Ole Brandt, Andrea Deiwick, et al.
and at 532 nm compared to 1064 nm. With 1064-nm file of the laser pulse proves to be independent on the
wavelength, slightly smaller droplets can be printed. pulse duration, as shown for 8- and 200-ns pulses in
Figure 4A depicts stroboscopic images with de- Figure 5D.
fined delay relative to the laser pulse impact for the Stroboscopic imaging of the printing process de-
three different wavelengths with different pulse ener- picts that the process and its time scale is independent
gies of 20 µJ (1064 nm), 12 µJ (532 nm), and 8 µJ on different pulse durations from 8 ns to 200 ns (shown
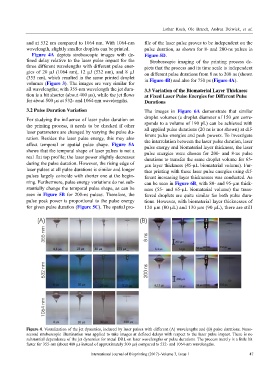
(355 nm), which resulted in the same printed droplet in Figure 4B) and also for 750 ps (Figure 4A).
volumes (Figure 3). The images are very similar for
all wavelengths; with 355-nm wavelength the jet dura- 3.3 Variation of the Biomaterial Layer Thickness
tion is a bit shorter (about 400 µs), while the jet flows at Fixed Laser Pulse Energies for Different Pulse
for about 500 µs at 532- and 1064-nm wavelengths. Durations
3.2 Pulse Duration Variation The images in Figure 6A demonstrate that similar
For studying the influence of laser pulse duration on droplet volumes (a droplet diameter of 150 µm corre-
the printing process, it needs to be checked if other sponds to a volume of 190 pL) can be achieved with
laser parameters are changed by varying the pulse du- all applied pulse durations (20 ns is not shown) at dif-
ration. Besides the laser pulse energy, this may also ferent pulse energies and peak powers. To investigate
the interrelation between the laser pulse duration, laser
affect temporal or spatial pulse shape. Figure 5A pulse energy and biomaterial layer thickness, the laser
shows that the temporal shape of laser pulses is not a pulse energies were chosen for 200- and 8-ns pulse
real flat top profile; the laser power slightly decreases durations to transfer the same droplet volume for 65-
during the pulse duration. However, the rising edge of µm layer thickness (45-µL biomaterial volume). Fur-
laser pulses at all pulse durations is similar and longer ther printing with these laser pulse energies using dif-
pulses largely coincide with shorter one at the begin- ferent increasing layer thicknesses was conducted. As
ning. Furthermore, pulse energy variations do not sub- can be seen in Figure 6B, with 80- and 95-µm thick-
stantially change the temporal pulse shape, as can be ness (55- and 65-µL biomaterial volume) the trans-
seen in Figure 5B for 200-ns pulses. Therefore, the ferred droplets are quite similar for both pulse dura-
pulse peak power is proportional to the pulse energy tions. However, with biomaterial layer thicknesses of
for given pulse duration (Figure 5C). The spatial pro- 120 µm (80 µL) and 130 µm (90 µL), there are still
Figure 4. Visualization of the jet dynamics, induced by laser pulses with different (A) wavelengths and (B) pulse durations. Nano-
second stroboscopic illumination was applied to take images at defined delays with respect to the laser pulse impact. There is no
substantial dependence of the jet dynamics for metal DRL on laser wavelengths or pulse durations. The process merely is a little bit
faster for 355-nm (about 400 µs instead of approximately 500 µs) compared to 532- and 1064-nm wavelengths.
International Journal of Bioprinting (2017)–Volume 3, Issue 1 47