
Page 378 - IJB-10-3
P. 378
International Journal of Bioprinting Multi-physical field control inkjet bioprinting
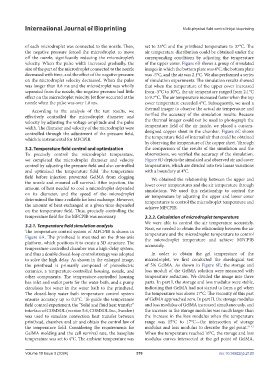
of each microdroplet was connected to the nozzle. Then, set to 25°C and the printhead temperature to 37°C. The
the negative pressure forced the microdroplet to move air temperature distribution could be obtained under the
off the nozzle, significantly reducing the microdroplet’s corresponding conditions by adjusting the temperature
velocity. When the pulse width increased gradually, the of the upper cover. Figure 6B shows a group of simulated
size of the part of the microdroplet connected to the nozzle images in which the bottom plate was 4°C, the bottom plate
decreased with time, and the effect of the negative pressure was -5°C, and the air was 2.1°C. We also performed a series
on the microdroplet velocity decreased. When the pulse of simulation experiments. The simulation results showed
was longer than 0.8 ms and the microdroplet was wholly that when the temperature of the upper cover increased
separated from the nozzle, the negative pressure had little from -5°C to 10°C, the air temperature ranged from 2.1°C
effect on the microdroplet velocity. Jet flow occurred at the to 9.7°C. The air temperature increased faster when the top
nozzle when the pulse was over 1.8 ms. cover temperature exceeded 4°C. Subsequently, we used a
According to the analysis of the test results, we thermal imager to observe the actual air temperature and
effectively controlled the microdroplet diameter and verified the accuracy of the simulation results. Because
velocity by adjusting the voltage amplitude and the pulse the thermal imager could not be used to photograph the
width. The diameter and velocity of the microdroplet were temperature field of the air inside, we placed a custom-
controlled through the adjustment of the pressure field, designed copper sheet in the chamber. Figure 6C shows
which is instrumental for MFCPIB. the temperature field of internal air that could be obtained
by observing the temperature of the copper sheet. Through
3.2. Temperature field control and optimization the comparison of the results of the simulation and the
To precisely control the microdroplet temperature, observations, we verified the accuracy of the simulation.
we completed the microdroplet diameter and velocity Figure 6D depicts the simulated and observed air and cover
control by adjusting the pressure field and also controlled temperatures, which are divided into two linear variations
and optimized the temperature field. The temperature with a boundary at 4°C.
field before injection prevented GelMA from clogging We obtained the relationship between the upper and
the nozzle and ensured cell survival. After injection, the lower cover temperatures and the air temperature through
amount of heat needed to cool a microdroplet depended simulations. We used this relationship to control the
on its diameter, and the speed of the microdroplet air temperature by adjusting the upper and lower cover
determined the time available for heat exchange. However, temperatures to control the microdroplet temperature and
the amount of heat exchanged at a given time depended achieve MFCPIB.
on the temperature field. Thus, precisely controlling the
temperature field for the MFCPIB was necessary. 3.2.2. Calculation of microdroplet temperature
We were able to control the air temperature accurately.
3.2.1. Temperature field simulation analysis Next, we needed to obtain the relationship between the air
The temperature control system of MFCPIB is shown in temperature and the microdroplet temperature to control
Figure 6A. The printhead is mounted on the three-axis the microdroplet temperature and achieve MFCPIB
platform, which positions it to create a 3D structure. The accurately.
temperature-controlled chamber was a high-delay system,
and thus a double closed-loop control strategy was adopted In order to obtain the gel temperature of the
to solve the high delay. As shown in the enlarged image, microdroplet, we first conducted the rheological test
the printhead is primarily composed of piezoelectric of 5% GelMA. As shown in Figure 6E, the storage and
ceramics, a temperature-controlled housing, nozzle, and loss moduli of the GelMA solution were measured with
other components. The temperature-controlled housing temperature reduction. We divided the image into three
has inlet and outlet ports for the water bath, and a pump parts. In part I, the storage and loss modulus were stable,
circulates hot water in the water bath to the printhead. indicating that GelMA had not started to form a gel when
The closed-loop water bath temperature control system the temperature was above 17°C. The viscosity of this part
ensures accuracy up to 0.1°C. To guide the temperature of GelMA approached zero. In part II, the storage modulus
field control experiment, the “Solid and fluid heat transfer” and loss modulus of GelMA increased simultaneously, and
interface of COMSOL (version 5.6, COMSOL Inc., Sweden) the increase in the storage modulus was much larger than
was used to simulate convection heat transfer between the increase in the loss modulus when the temperature
printhead, chamber, and air and obtain the control law of range was 15°C to 17°C—the intersection of storage
the temperature field. Considering the requirements for modulus and loss modulus to describe the gel point. 41-43
GelMA molding and the cell survival rate, the baseplate When the temperature reached 16°C, the storage and loss
temperature was set to 4°C. The ambient temperature was modulus curves intersected at the gel point of GelMA,
Volume 10 Issue 3 (2024) 370 doi: 10.36922/ijb.2120