
Page 397 - IJB-10-3
P. 397
International Journal of Bioprinting Optimizing 3D-printed mouthguards
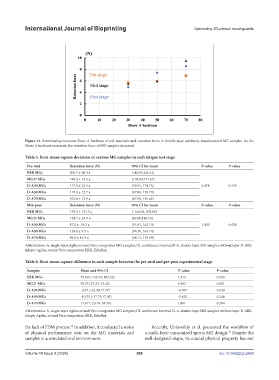
Figure 11. Relationships between Shore A hardness of soft materials and retention force in double-layer additively manufactured MG samples. As the
Shore A hardness increased, the retention force of MG samples increased.
Table 5. Root-mean-square deviation of various MG samples in each fatigue test stage
Pre-mid Retention force (N) 95% CI for mean F-value P-value
ERK MGs 200.7 ± 98.5 a (-44.07,445.41)
MG21 MGs 140.3 ± 14.2 a (105.00,175.67)
D-A30 MGs 117.3 ± 23.1 a (59.91, 174.76) 2.078 0.159
D-A50 MGs 119.3 ± 12.7 a (87.88, 150.79)
D-A70 MGs 102.0 ± 13.9 a (67.58, 136.42)
Mid-post Retention force (N) 95% CI for mean F-value P-value
ERK MGs 179.3 ± 131.5 a (-144.03, 502.69)
MG21 MGs 124.7 ± 24.9 b (62.80,186.54)
D-A30 MGs 97.0 ± 18.2 a (51.81, 142.19) 1.029 0.438
D-A50 MGs 120.0 ± 9.5 a (96.30, 143.70)
D-A70 MGs 89.0 ± 16.5 a (48.11, 129.89)
Abbreviation: A, single-layer Agilus or/and Vero composites MG samples; CI, confidence interval; D-A, double-layer MG samples without layer D-ABS,
inlayer Agilus, or/and Vero composites; ERK, Erkoflex.
Table 6. Root-mean-square difference in each sample between the pre-mid and pre-post experimental stage
Samples Mean and 95% CI T-value P-value
ERK MGs 75.00 (-153.53, 303.52) 1.412 0.293
MG21 MGs 50.33 (27.25, 73.42) 9.383 0.011
D-A30 MGs -2.67 (-22.90,17.57) -0.567 0.628
D-A50 MGs -10.33 (-37.79,17.03) -1.625 0.246
D-A70 MGs 17.67 (-23.18, 58.51) 1.861 0.204
Abbreviation: A, single-layer Agilus or/and Vero composites MG samples; CI, confidence interval; D-A, double-layer MG samples without layer D-ABS,
inlayer Agilus, or/and Vero composites; ERK, Erkoflex.
35
the lack of FDM process. In addition, it conducted a series Recently, Unkovskiy et al. presented the workflow of
36
of physical performance tests on the MG materials and a multi-layer customized sports MG design. Despite the
samples in a simulated oral environment. well-designed shape, its crucial physical property has not
Volume 10 Issue 3 (2024) 389 doi: 10.36922/ijb.2469