
Page 392 - IJB-10-3
P. 392
International Journal of Bioprinting Optimizing 3D-printed mouthguards
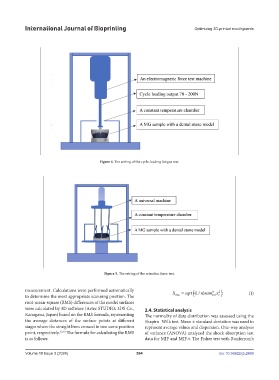
Figure 4. The setting of the cycle-loading fatigue test.
Figure 5. The setting of the retention force test.
measurement. Calculations were performed automatically X = sqrt( (/ )1 n sumx ) (I)
n
2
to determine the most appropriate scanning position. The rms i=1 i
root-mean-square (RMS) differences of the model surfaces
were calculated by 3D software (Artec STUDIO; 3DS Co., 2.4. Statistical analysis
Kanagawa, Japan) based on the RMS formula, representing The normality of data distribution was assessed using the
the average distances of the surface points at different Shapiro–Wilk test. Mean ± standard deviation was used to
stages where the straight lines crossed in two same position represent average values and dispersion. One-way analysis
point, respectively. 32,33 The formula for calculating the RMS of variance (ANOVA) analyzed the shock absorption test
is as follows: data for MIF and MIF-t. The Fisher test with Bonferroni’s
Volume 10 Issue 3 (2024) 384 doi: 10.36922/ijb.2469