
Page 395 - IJB-10-3
P. 395
International Journal of Bioprinting Optimizing 3D-printed mouthguards
Table 3. Fisher analysis of the broken result of three types of MG samples during mid-fatigue test
MG groups Broken (%) Unbroken (%) χ value P-value
2
Conventional MGs (n = 6) 0 (0.0) 6 (100.0) 24.39 <0.001
Single-layer additively manufactured MGs (n = 9) 9 (100) 0 (0.0)
Double-layer additively manufactured MGs (n = 9) 0 (0.0) 9 (100.0)
Table 4. Retention force for each sample in each fatigue test stage
Retention force (N)
Fatigue test stages
Pre Mid Post
ERK MGs 29.0 ± 2.2 37.4 ± 4.2 34.9 ± 9.4
MG21 MGs 33.0 ± 4.7 42.7 ± 3.1 44.0 ± 4.4
D-A30 MGs 5.7 ± 0.6 5.4 ± 0.3 4.9 ± 0.1
D-A50 MGs 5.9 ± 0.4 5.9 ± 0.0 7.4 ± 0.3
D-A70 MGs 6.9 ± 0.2 9.5 ± 0.4 8.6 ± 1.5
MG21: P < 0.043 pre v. post.
Pre-fatigue: P < 0.001 ERK, MG21 v. D-A all MGs
Mid-fatigue: P < 0.001 ERK, MG21 v. D-A all MGs
Post-fatigue: P < 0.001 ERK, MG21 v. D-A all MGs
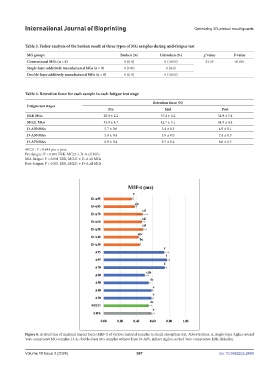
Figure 8. Arrival time of maximal impact force (MIF-t) of various material samples in shock absorption test. Abbreviations: A, single-layer Agilus or/and
Vero composites MG samples; D-A, double-layer MG samples without layer D-ABS, inlayer Agilus, or/and Vero composites; ERK, Erkoflex.
Volume 10 Issue 3 (2024) 387 doi: 10.36922/ijb.2469