
Page 463 - IJB-10-3
P. 463
International Journal of Bioprinting Biomimetic scaffolds for tendon healing
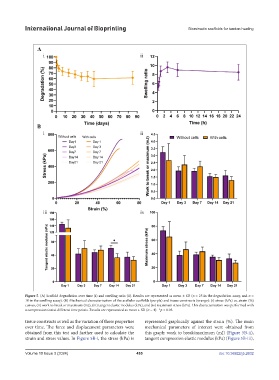
Figure 5. (A) Scaffold degradation over time (i) and swelling ratio (ii). Results are represented as mean ± SD (n = 25 in the degradation assay, and n =
10 in the swelling assay). (B) Mechanical characterization of the acellular scaffolds (purple) and tissue constructs (orange): (i) stress (kPa) vs. strain (%)
curves, (ii) work to break or maximum (mJ), (iii) tangent elastic modulus (kPa), and (iv) maximum stress (kPa). This characterization was performed with
a compression test at different time points. Results are represented as mean ± SD (n = 4). *p < 0.05.
tissue constructs as well as the variation of those properties represented graphically against the strain (%). The main
over time. The force and displacement parameters were mechanical parameters of interest were obtained from
obtained from this test and further used to calculate the this graph: work to break/maximum (mJ) (Figure 5B-ii),
strain and stress values. In Figure 5B-i, the stress (kPa) is tangent compression elastic modulus (kPa) (Figure 5B-iii),
Volume 10 Issue 3 (2024) 455 doi: 10.36922/ijb.2632