
Page 466 - IJB-10-3
P. 466
International Journal of Bioprinting Biomimetic scaffolds for tendon healing
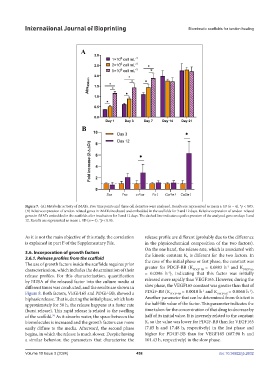
Figure 7. (A) Metabolic activity of iMATs. Five time points and three cell densities were analyzed. Results are represented as mean ± SD (n = 4). *p < 0.05.
(B) Relative expression of tendon-related genes in iMATs incubated and embedded in the scaffolds for 3 and 12 days. Relative expression of tendon-related
genes in iMATs embedded in the scaffolds after incubation for 3 and 12 days. The dashed line indicates equal expression of the analyzed gene on days 3 and
12. Results are represented as mean ± SD (n = 4). *p < 0.05.
As it is not the main objective of this study, the correlation release profile are different (probably due to the difference
is explained in part F of the Supplementary File. in the physicochemical composition of the two factors).
On the one hand, the release rate, which is associated with
3.6. Incorporation of growth factors the kinetic constant K, is different for the two factors. In
3.6.1. Release profiles from the scaffold
The use of growth factors inside the scaffolds requires prior the case of the initial phase or fast phase, the constant was
= 0.0883 h and K
greater for PDGF-BB (K
-1
characterization, which includes the determination of their -1 PDGF-BB VEGF165
release profiles. For this characterization, quantification = 0.0396 h ), indicating that this factor was initially
by ELISA of the released factor into the culture media at released more rapidly than VEGF165. However, during the
different times was conducted, and the results are shown in slow phase, the VEGF165 constant was greater than that of
-1
-1
Figure 8. Both factors, VEGF165 and PDGF-BB, showed a PDGF-BB (K PDGF-BB = 0.0010 h and K VEGF165 = 0.0068 h ).
biphasic release. That is, during the initial phase, which lasts Another parameter that can be determined from this test is
approximately for 50 h, the release happens at a faster rate the half-life value of the factor. This parameter indicates the
(burst release). This rapid release is related to the swelling time taken for the concentration of that drug to decrease by
of the scaffold. As it absorbs water, the space between the half of its initial value. It is inversely related to the constant
79
biomolecules is increased and the growth factors can more K, so the value was lower for PDGF-BB than for VEGF165
easily diffuse to the media. Afterward, the second phase (7.85 h and 17.48 h, respectively) in the fast phase and
begins, in which the release is much slower. Despite having higher for PDGF-BB than for VEGF165 (687.90 h and
a similar behavior, the parameters that characterize the 101.43 h, respectively) in the slow phase.
Volume 10 Issue 3 (2024) 458 doi: 10.36922/ijb.2632