
Page 479 - IJB-10-3
P. 479
International Journal of Bioprinting Stretchable scaffold for modeling fibrosis
semicircles with a radius (R) of 1 mm (Figure 1A). The through Castigliano’s theorem, by determining the
23
inter-fiber distance between two close wavy and straight displacements due to tensile and bending contributions.
filaments in each layer was 1.5 and 2 mm, respectively By considering a single beam element as a spring,
(Figure 1A). This was considered as the unit cell for the each wavy filament is a spring series along the horizontal
stretchable PCL mesh. The cross-section of each filament direction while their assembly along the vertical direction
was approximated to a rectangle with an area b × h derived is a spring parallel (Figure 3A–C). Total scaffold stiffness
from scanning electron microscopy (SEM) and optical was estimated by calculating the stiffness of a single wavy
microscopy analyses (Figure 1B). The 2D mesh model with filament made of j-beam elements in series and multiplying
two layers and the 3D mesh model with eight layers are this value by the i value of filaments along the vertical
displayed in Figure 1C and D, respectively.
direction (Table 2).
2.3. Mechanical modeling
2.3.2. Finite element method analysis of
2.3.1. Structural analysis of scaffold stiffness poly(ε-caprolactone) scaffolds
Structural analysis aimed to define the proper PCL The mechanical behavior of the PCL scaffolds was
mesh design in terms of thickness (number of layers) investigated using 1D static structural FEM via the Ansys
to ensure cardiac tissue-like stiffness and stretchability Workbench R22.1 software. In detail, FEM simulation was
under physiological mechanical stimulation (i.e., Young’s used for computing displacement behavior under tensile
modulus between 400 kPa and 9 MPa, and bearing an force and consequent stiffness evaluation. Moreover, Von
elastic deformation ≤22%). 21–23 PCL mesh stiffness was Mises stress distribution was displaced to evaluate stress
calculated considering the repeating half-semicircle accumulation points. Since the construct was intended
element of the wavy pattern (Figure 1A) approximated to be used within its elastic field limit, analysis was
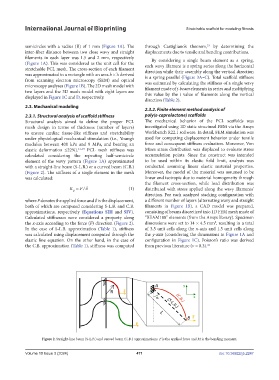
with a straight-line beam (S-L.B.) or a curved beam (C.B.) conducted assuming linear elastic material properties.
(Figure 2). The stiffness of a single element in the mesh Moreover, the model of the material was assumed to be
was calculated: linear and isotropic due to material homogeneity through
the filament cross-section, while load distribution was
K = F /δ (1) distributed with stress applied along the wavy filaments’
ij
direction. For each analyzed stacking configuration with
where F denotes the applied force and δ is the displacement, a different number of layers (alternating wavy and straight
both of which are computed considering S-L.B. and C.B. filaments in Figure 1B), a CAD model was prepared,
approximations, respectively (Equations SIII and SIV). consisting of beams discretized into 1D FEM mesh made of
Calculated stiffnesses were considered a property along “BEAM188” elements (from the Ansys library). Specimen
the x-axis according to the force (F) direction (Figure 2). dimensions were set to 14 × 4.5 mm , resulting in a total
2
In the case of S-L.B. approximation (Table 1), stiffness of 3.5 unit cells along the x-axis and 1.5 unit cells along
was calculated using displacement computed through the the y-axis (considering the dimensions in Figure 1A and
elastic line equation. On the other hand, in the case of configuration in Figure 1C). Poisson’s ratio was derived
the C.B. approximation (Table 1), stiffness was computed from previous literature (v = 0.3). 32
Figure 2. Straight-line beam (S-L.B.) and curved beam (C.B.) approximations. F is the applied force and M is the bending moment.
Volume 10 Issue 3 (2024) 471 doi: 10.36922/ijb.2247