
Page 522 - IJB-10-3
P. 522
International Journal of Bioprinting Drop-on-demand laser bioprinting
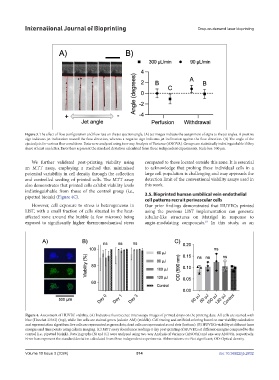
Figure 3. The effect of flow configuration and flow rate on the jet ejection angle. (A) Jet images indicate the assignment of signs to the jet angles. A positive
sign indicates jet inclination toward the flow direction, whereas a negative sign indicates jet inclination against the flow direction. (B) The angle of the
ejected jets for various flow conditions. Data were analyzed using two-way Analysis of Variance (ANOVA). Groups are statistically indistinguishable if they
share at least one letter. Error bars represent the standard deviation calculated from three independent experiments. Scale bar: 500 μm.
We further validated post-printing viability using compared to those located outside this zone. It is essential
an MTT assay, employing a method that minimized to acknowledge that probing these individual cells in a
potential variability in cell density through the collection large cell population is challenging and may approach the
and controlled seeding of printed cells. The MTT assay detection limit of the conventional viability assays used in
also demonstrates that printed cells exhibit viability levels this work.
indistinguishable from those of the control group (i.e.,
pipetted bioink) (Figure 4C). 3.5. Bioprinted human umbilical vein endothelial
cell patterns recruit perivascular cells
However, cell exposure to stress is heterogeneous in Our prior findings demonstrated that HUVECs printed
LIST, with a small fraction of cells situated in the heat- using the previous LIST implementation can generate
affected zone around the bubble (a few microns) being tubular-like structures on Matrigel in response to
exposed to significantly higher thermomechanical stress angio-modulating compounds. In this study, as an
23
Figure 4. Assessment of HUVEC viability. (A) Indicative fluorescence microscopy images of printed drops on the printing date. All cells are stained with
blue (Hoechst 33342) (top), while live cells are stained green (calcein AM) (middle). Cell tracing and artificial coloring based on our viability calculation
and representation algorithm: live cells are represented as green dots; dead cells are represented as red dots (bottom). (B) HUVECs viability at different laser
energies and time points using calcein imaging. (C) MTT assay absorbance readings 1 day post-printing of HUVECs at different energies compared to the
control (i.e., pipetted bioink). Data in graphs (B) and (C) were analyzed using two-way Analysis of Variance (ANOVA) and one-way ANOVA, respectively.
Error bars represent the standard deviation calculated from three independent experiments. Abbreviations: ns: Not significant; OD: Optical density.
Volume 10 Issue 3 (2024) 514 doi: 10.36922/ijb.2832