
Page 523 - IJB-10-3
P. 523
International Journal of Bioprinting Drop-on-demand laser bioprinting
initial exploration of the vascular modeling capability movement along the printed lines, whereas those situated
of printed HUVECs, we investigated their potential farther from the lines tended to cluster without a discernible
to attract perivascular cells, a critical component of directional preference.
vascular remodeling.
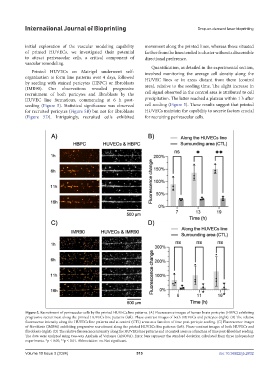
Quantification, as detailed in the experimental section,
Printed HUVECs on Matrigel underwent self- involved monitoring the average cell density along the
organization to form line patterns over 4 days, followed HUVEC lines or in areas distant from them (control
by seeding with stained pericytes (HBPC) or fibroblasts
(IMR90). Our observations revealed progressive area), relative to the seeding time. The slight increase in
recruitment of both pericytes and fibroblasts by the cell signal observed in the control area is attributed to cell
HUVEC line formations, commencing at 6 h post- precipitation. The latter reached a plateau within 1 h after
seeding (Figure 5). Statistical significance was observed cell seeding (Figure 5). These results suggest that printed
for recruited pericytes (Figure 5B) but not for fibroblasts HUVECs maintain the capability to secrete factors crucial
(Figure 5D). Intriguingly, recruited cells exhibited for recruiting perivascular cells.
Figure 5. Recruitment of perivascular cells by the printed HUVECs line patterns. (A) Fluorescence images of human brain pericytes (HBPC) exhibiting
progressive recruitment along the printed HUVECs line patterns (left). Phase-contrast images of both HUVECs and pericytes (right). (B) The relative
fluorescence intensity along the HUVECs line patterns and at control (CTL) areas as a function of time post-pericyte seeding. (C) Fluorescence images
of fibroblasts (IMR90) exhibiting progressive recruitment along the printed HUVECs line patterns (left). Phase-contrast images of both HUVECs and
fibroblasts (right). (D) The relative fluorescence intensity along the HUVECs line patterns and at control areas as a function of time post-fibroblast seeding.
The data were analyzed using two-way Analysis of Variance (ANOVA). Error bars represent the standard deviation calculated from three independent
experiments. *p ≤ 0.05; **p ≤ 0.01. Abbreviation: ns: Not significant.
Volume 10 Issue 3 (2024) 515 doi: 10.36922/ijb.2832