
Page 113 - IJB-4-1
P. 113
Sriphutkiat Y, et al
cell spheroid may also be possible using SSAW at the from the culture medium [62–64] , which may slow down cell
excitation frequency of 7.4 MHz at the cell density of growth and lead to necrotic death [65] . After being transferred
clogging at the outlet of cavity when collecting them. Some out of the PDMS cavity and collected in a culture dish,
cell spheroids generated are about 200 µm. Such a large the fresh cell spheroids have clear outlines of individual
6
30×10 cells/mL. cells. After 4 h, the cells in the formed spheroids start to
merge with the adjacent cells. Within a day, the cell outlines
3.3 Growth of Cell Spheroids in the spheroid become blurred, showing the significant
After the acoustic excitation, cell spheroids were collected cell mergence. On day 3, all cells inside the spheroid merge
and cultured in the incubator for up to 7 days to monitor almost completely with the disappearance of cell outlines,
their growth. All formed cell spheroids grow quite well especially those at the center. After that, there are no more
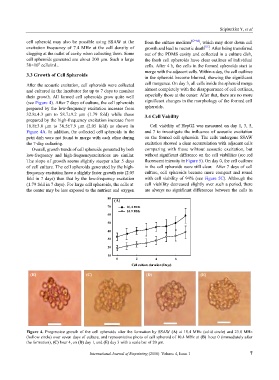
(see Figure 4). After 7 days of culture, the cell spheroids significant changes in the morphology of the formed cell
prepared by the low-frequency excitation increase from spheroids.
32.8±4.3 μm to 58.7±9.2 μm (1.79 fold) while those 3.4 Cell Vability
prepared by the high-frequency excitation increase from
18.8±3.0 μm to 38.5±7.9 μm (2.05 fold) as shown in Cell viability of HepG2 was measured on day 1, 3, 5,
Figure 4A. In addition, the collected cell spheroids in the and 7 to investigate the influence of acoustic excitation
petri dish were not found to merge with each other during on the formed cell spheroids. The cells undergone SSAW
the 7-day culturing. excitation showed a clear accumulation with adjacent cells
Overall, growth trends of cell spheroids generated by both comparing with those wihtout acosutic excitation, but
low-frequency and high-frequencyexcitations are similar. without significant difference on the cell viabilities (see red
The slope of growth seems slightly steeper after 5 days fluorescent intensity in Figure 5). On day 0, the cell outlines
of cell culture. The cell spheroids generated by the high- in the cell spheroids were still clear. After 7 days of cell
frequency excitation have a slightly faster growth rate (2.05 culture, cell spheroids became more compact and round
fold in 7 days) than that by the low-frequency excitation with cell viability of 94% (see Figure 5C). Although the
(1.79 fold in 7 days). For large cell spheroids, the cells at cell viability decreased slightly over such a period, there
the center may be less exposed to the nutrient and oxygen are always no significant differences between the cells in
80 (A)
70 10.4 MHz
24.9 MHz
60
50
40
30
20
10
0 2 4 6
Cell culture duration (Days)
(B) (C) Diam eter of cell spheriods ( (D) (E)
祄
)
Figure 4. Progressive growth of the cell spheroids after the formation by SSAW (A) at 10.4 MHz (solid circle) and 23.8 MHz
(hollow circle) over seven days of culture, and representative photo of cell spheroid of 10.4 MHz at (B) hour 0 (immediately after
the formation), (C) hour 4, on (D) day 1, and (E) day 3 with a scale bar of 20 μm.
International Journal of Bioprinting (2018)–Volume 4, Issue 1 7