
Page 110 - IJB-4-1
P. 110
Formation of cell spheroids using Standing Surface Acoustic Wave (SSAW)
Logan, UT, USA) containing 10% fetal bovine serum (FBS, and compared. It is assumed that all individual cells were
Gibco, Waltham, MA, USA) and 1% antibiotic-antimycotic distributed uniformly across the PDMS cavity and do not
solution, including 10,000 units/mL of penicillin, 10,000 gather before reaching the pressure node. In this simulation,
µg/mL of streptomycin, and 25 µg/mL of amphotericin B the motion of cells and the time required to reach the
(Gibco), in a cell culture flask (t75, ThermoFisher Scientific). equilibrium state are highly dependent on the equivalent
The cells were incubated at 37 °C in a humidified incubator force applied to them and their initial location. It is found
(Heracell 150i, ThermoFisher Scientific) under the condition that the trajectory motion of cells in the SSAW field can
of 5% CO 2 . The culture medium was changed every two be fitted by an exponential rise curve and the rising rate is
or three days depending on the initial seeding. Achieving dependent on the initial distance to the pressure node and
80% confluence, the cell was dissociated using 0.25% acoustic operating parameters, such as the excitation
Trypsin 1 mM EDTA.4Na (Lonza, Basel, Switzerland), frequency and power (see Figure 2). The correlationbetween
centrifuged at 1,000 RPM (SL 8 small benchtop centrifuge, acoustics parameters (e.g., excitation frequency, power
ThermoFisher Scientific) for 5 min at room temperature, output) and cell motion by SSAW was listed in Table 2.
and subsequently re-suspended in the culture medium in Firstly, the cell motion across the cavity by either low- and
6
a concentration of 210 cells/mL and a volume of about high-frequency SSAW at different initial positions is shown
400 µL. Cell density was estimated using hemocytometer in Figures 2A and B. It is clear that using the high-
(Hausser scientific hemocytometer, ThermoFisher Scientific). frequency excitation could accumulate the cells much
Live/dead cell viability assays (L3224, L/D kit for more quickly. The effects of output power and cell diameter
mammalian cells, ThermoFisher Scientific) consisting of on the trajectory motion of cell were also investigated if
calcein-AM and ethidium homodimer-1 were used to stain
the cells. The samples in 5 random areas were captured the distance between the initial position and pressure node
by the optical microscope and processed with ImageJ using is fixed as 42 μm which is one-quarter of wavelength or
the established protocols [43,44] to count the live and dead the distance from anti-pressure node to adjacent pressure
cells stained in green and red, respectively. The cell node at the high-frequency excitation. Referring to Eq.2,
spheroids were then cultured in ultralow attachable culture acoustic radiation force is proportional to the volume of
®
dish (#3262 Corning , Thermo Fisher Scientific) to minimize the cell (or cube of cell diameter in the shape of a sphere)
the cell attachment. The spheroid size and cell viability were and the power (or square of acoustic pressure). Large cells
measured daily for 7 days [36,45] . reach the pressure node in a short time because of large
acoustic radiation force applied to them (see Figure 2C).
3. Results and Discussion At the high-frequency excitation, the cells in a diameter of 8
μm, 10 μm, and 15 μm at the acoustic excitation power of
3.1 Numerical Simulation of Cell Motion by SSAW 1.0 W reach the pressure node after 6.26 s, 4.01 s, and 1.78 s,
Using a network analyzer (HP8510B, Agilent Technologies, respectively. In comparison, the corresponding values at
Santa Clara, CA, USA), the S 12 frequency response of the low-frequency excitation are 13.58 s, 8.70 s, and 3.87 s,
IDTs (transmission coefficient) shows several peaks [42] . respectively, almost twice as those at the high frequency. In
Trajectories of biological cells excited by low-frequency addition, the motion time required to reach the pressure
(10.4 MHz) and high-frequency (23.8 MHz) were simulated node also decreases with the output power (see Figure 2D).
(B) IDTs
(A) Individual
cells
Function
Generator Power Amplifier Device
PDMS
Cell
spheroid
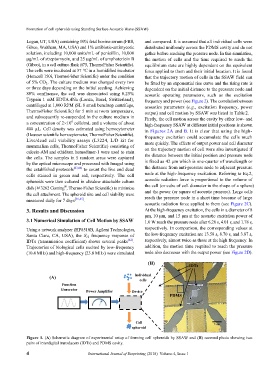
Figure 1. (A) Schematic diagram of experimental setup of forming cell spheroids by SSAW and (B) zoomed photo showing two
pairs of interdigital transducers (IDTs) and PDMS cavity.
4 International Journal of Bioprinting (2018)–Volume 4, Issue 1