
Page 417 - IJB-10-4
P. 417
International Journal of Bioprinting Pregabalin impact on 3D neuronal models
Germany). To eliminate bias, neurites shorter than 20 examined with appropriate assessment tools. Untreated
21
μm and overlapping neurites were excluded from the cultures were employed as control groups. Three biological
analysis. Untreated cultures were used as control groups. replicates were prepared for each experiment. First, ECNs
Three biological replicates were carried out, encompassing were seeded at a density of 2 million cells per 6-well cell
both treated and control groups. Within each biological culture plate for RNA preparation. Using the RNeasy Plus
replication, we conducted three technical replicates, and Universal Mini Kit (Cat No. 73404; Qiagen, Germany),
in each technical replicate, we assessed 10 neurons, with a RNA was isolated after 3 days of culture based on the
total of 90 neurons analyzed per experimental condition. manufacturer’s instructions. As per the methodology
To quantify the effects of pregabalin treatment, the data of the RNeasy kit, TissueLyser II (Qiagen, Germany)
obtained from pregabalin-treated cultures were normalized was used to effectively homogenize the cells. Cortical
to the corresponding control group data. The results were neurons from control and pregabalin-treated cells were
reported as a percentage change from the control, where used to isolate RNA. RNA extraction from mouse tissues,
the control group data served as the reference point excluding brain tissue, served as a negative control
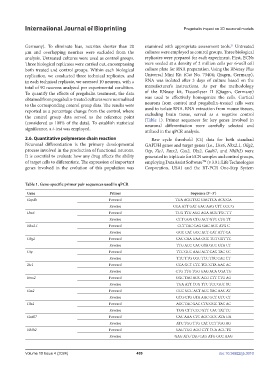
(Table 1). Primer sequences for key genes involved in
(considered as 100% of the data). To establish statistical neuronal differentiation were carefully selected and
significance, a t-test was employed. utilized in the qPCR analysis.
2.6. Quantitative polymerase chain reaction Raw cycle threshold (Ct) data for both standard
Neuronal differentiation is the primary developmental GAPDH genes and target genes (i.e., Lhx6, Nkx2.1, Olig2,
process involved in the production of functional neurons. Otp, Zic1, Emx2, Gsx2, Dlx2, Gad67, and NhIh2) were
It is essential to evaluate how any drug affects the ability generated in triplicate for ECN samples and control groups,
of target cells to differentiate. The expression of important employing DataAssist Software (v 3.01; Life Technologies
TM
genes involved in the evolution of this population was Corporation, USA) and the RT-PCR One-Step System
Table 1. Gene-specific primer pair sequences used in qPCR
Gene Primer Sequence (5ʹ–3ʹ)
Gapdh Forward TGA AGG TCG GAG TCA ACG GA
Reverse CCA ATT GAT GAC AAG CTT CCC G
Lhx6 Forward TCG TTG AGG AGA AGG TGC TT
Reverse CTT GGG CTG ACT GTC CTG TT
Nkx2.1 Forward CCT TAC CAG GAC ACC ATG C
Reverse GCC CAT GCC ACT CAT ATT CA
Olig2 Forward CAC CAA GAA GCC TGT CGT TC
Reverse TTG ACC CAC GTA GCC GTA CT
Otp Forward TTC GCC AAG ACT CAC TAC CC
Reverse TTC TTG CGC TTC TTC CAC TT
Zic1 Forward CCA GCT CTC TGC GTA AAC AC
Reverse CTG TTG TGG GAG ACA CGA TG
Emx2 Forward GGC TAG AGC ACG CTT TTG AG
Reverse TGA ATT TCG TTC TCC GGT TC
Gsx2 Forward GCC GCC ACT ACC TAC AAC AT
Reverse GTG CTG GTA AAC GCT GTC CT
Dlx2 Forward AGC TAC GAC CTG GGC TAC AC
Reverse TGG CTT CCC GTT CAC TAT TC
Gad67 Forward CAC AAA CTC AGC GGC ATA GA
Reverse ATC TGG TTG CAT CCT TGG AG
NhIh2 Forward GAG TGG AGG CTT TCA ACC TG
Reverse GAG ATG TAG CAG ATG GCC AAG
Volume 10 Issue 4 (2024) 409 doi: 10.36922/ijb.3010