
Page 461 - IJB-10-4
P. 461
International Journal of Bioprinting Biomechanical mimic-based artificial oviduct system
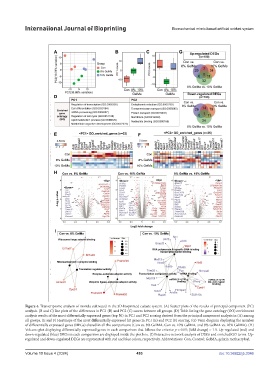
Figure 4. Transcriptome analysis of morula cultivated in the 3D-bioprinted culture system. (A) Scatter plots of the results of principal component (PC)
analysis. (B and C) Bar plots of the differences in PC1 (B) and PC2 (C) scores between all groups. (D) Table listing the gene ontology (GO) enrichment
analysis results of the most differentially expressed genes (top 50) in PC1 and PC2 scoring derived from the principal component analysis in (A) among
all groups. (E and F) Heatmaps of the most differentially expressed hit genes in PC1 (E) and PC2 (F) scoring. (G) Venn diagram displaying the number
of differentially expressed genes (DEGs) shared in all the comparisons (Con vs. 8% GelMA, Con vs. 10% GelMA, and 8% GelMA vs. 10% GelMA). (H)
Volcano plot displaying differentially expressed genes in each comparison that follows the criteria: p < 0.05; |fold change| > 1.5. Up-regulated (red) and
down-regulated (blue) DEGs in each comparison are displayed inside the plot box. (I) Interactive network analysis of DEGs and enriched GO terms. Up-
regulated and down-regulated DEGs are represented with red and blue colors, respectively. Abbreviations: Con, Control; GelMA, gelatin methacryloyl.
Volume 10 Issue 4 (2024) 453 doi: 10.36922/ijb.3346