
Page 163 - IJB-10-5
P. 163
International Journal of Bioprinting Nozzle optimization for multi-ink bioprinting
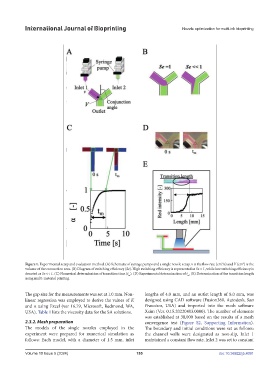
Figure 1. Experimental setup and evaluation method. (A) Schematic of syringe pumps and a single nozzle setup. v is the flow rate (cm /s) and V (cm ) is the
3
3
volume of the connection area. (B) Diagram of switching efficiency (Se). High switching efficiency is represented as Se = 1, while low switching efficiency is
denoted as Se << 1. (C) Numerical determination of transition time (t ). (D) Experimental determination of t . (E) Determination of the transition length
m
m
using multi-material printing.
The gap size for the measurements was set at 1.0 mm. Non- lengths of 4.0 mm, and an outlet length of 8.0 mm, was
linear regression was employed to derive the values of K designed using CAD software (Fusion360, Autodesk, San
and n using Excel (ver 16.79, Microsoft, Redmond, WA, Francisco, USA) and imported into the mesh software
USA). Table 1 lists the viscosity data for the SA solutions. Xsim (Ver. 0.15.20220403.0000). The number of elements
was established at 30,000 based on the results of a mesh
2.3.2. Mesh preparation convergence test (Figure S2, Supporting Information).
The models of the single nozzles employed in the The boundary and initial conditions were set as follows:
experiment were prepared for numerical simulation as the channel walls were designated as non-slip, Inlet 1
follows: Each model, with a diameter of 1.5 mm, inlet maintained a constant flow rate, Inlet 2 was set to constant
Volume 10 Issue 5 (2024) 155 doi: 10.36922/ijb.4091