
Page 167 - IJB-10-5
P. 167
International Journal of Bioprinting Nozzle optimization for multi-ink bioprinting
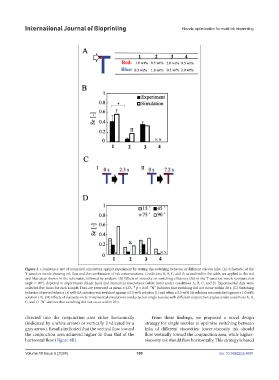
Figure 3. Consistency test of numerical simulation against experiment by testing the switching behavior of different viscous inks. (A) Schematic of the
T-junction nozzle showing ink flow and the combination of ink concentrations. Conditions A, B, C, and D, as outlined in the table, are applied to the red
and blue areas shown in the schematic, followed by analysis. (B) Effects of viscosity on switching efficiency (Se) in the T-junction nozzle (conjunction
angle = 90°), depicted in experiments (black bars) and numerical simulations (white bars) under conditions A, B, C, and D. Experimental data were
collected five times for each sample. Data are presented as mean ± S.D.; * p < 0.05. “N” indicates that switching did not occur within 20 s. (C) Switching
behavior observed when a 1.0 wt% SA solution was switched against a 0.5 wt% solution (I) and when a 0.5 wt% SA solution was switched against a 1.0 wt%
solution (II). (D) Effects of viscosity on Se in numerical simulations conducted on single nozzles with different conjunction angles under conditions A, B,
C, and D. “N” denotes that switching did not occur within 20 s.
directed into the conjunction area either horizontally From these findings, we proposed a novel design
(indicated by a white arrow) or vertically (indicated by a strategy for single nozzles to optimize switching between
gray arrow). Results indicated that the vertical flow toward inks of different viscosities: lower-viscosity ink should
the conjunction area achieved higher Se than that of the flow vertically toward the conjunction area, while higher-
horizontal flow (Figure 4B). viscosity ink should flow horizontally. This strategy is based
Volume 10 Issue 5 (2024) 159 doi: 10.36922/ijb.4091