
Page 351 - IJB-10-5
P. 351
International Journal of Bioprinting Printing organoids in peptide matrices
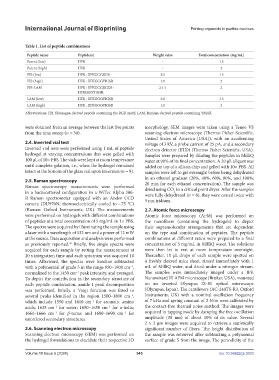
Table 1. List of peptide combinations
Peptide name Peptide(s) Weight ratio Total concentration (mg/mL)
Parent (low) IIFK - 1.5
Parent (high) IIFK - 2
FIB (low) IIFK : IIFKGGGRDS 2:1 1.5
FIB (high) IIFK : IIFKGGGYIGSR 1:1 2
FIB-LAM IIFK : IIFKGGGRGDS : 2:1:1 2
IIFKGGGYIGSR
LAM (low) IIFK : IIFKGGGYIGSR 2:1 1.5
LAM (high) IIFK : IIFKGGGYIGSR 1:1 2
Abbreviations: FIB, fibrinogen-derived peptide containing the RGD motif; LAM, laminin-derived peptide containing YIGSR.
were obtained from an average between the last five points morphology. SEM images were taken using a Teneo VS
from the time sweep (n = 30). scanning electron microscope (Thermo Fisher Scientific,
United States of America [USA]), with an accelerating
2.4. Inverted vial test voltage of 3 kV, a probe current of 25 pA, and a secondary
Inverted vial tests were performed using 1 mL of peptide electron detector (ETD) (Thermo Fisher Scientific, USA).
hydrogel at varying concentrations that were gelled with Samples were prepared by diluting the peptides in MilliQ
100 µL of 10× PBS. The vials were kept at room temperature water at 90% of its final concentration. A 20 µL aliquot was
until complete gelation, i.e., when the hydrogel remained added on top of a silicon chip and gelled with 10× PBS. All
intact at the bottom of the glass vial upon inversion (n = 9). samples were left to gel overnight before being dehydrated
in an ethanol gradient (20%, 40%, 60%, 80%, and 100%;
2.5. Raman spectroscopy
Raman spectroscopy measurements were performed 20 min for each ethanol concentration). The sample was
dried using CO in a critical point dryer. After the samples
in a backscattered configuration in a WiTec Alpha 300- were fully dehydrated (n = 6), they were coated twice with
2
R Raman spectrometer equipped with an Andor CCD 5 nm iridium.
camera (DU970N; thermoelectrically cooled to −75 °C)
(Raman: Oxford Instruments, UK). The measurements 2.7. Atomic force microscopy
were performed on hydrogels with different combinations Atomic force microscopy (AFM) was performed on
of peptides at a total concentration of 5 mg/mL in 1× PBS. the nanofibers (containing the hydrogels) to depict
The spectra were acquired by illuminating the sample using their supramolecular arrangements that are dependent
a laser with a wavelength of 532 nm and a power of 12 mW on the type and combination of peptides. The peptide
at the source. Data acquisition and analysis were performed combinations at different ratios were prepared to a final
as previously reported. Briefly, five single spectra were concentration of 3 mg/mL in MilliQ water. The solutions
36
acquired for each sample by setting the measurement at were then let to rest at room temperature overnight.
20 s integration time and each spectrum was acquired 10 Thereafter, 10 µL drops of each sample were spotted on
times. Afterward, the spectra were baseline subtracted a freshly cleaved mica sheet, rinsed immediately with 1
with a polynomial of grade 5 in the range 950–1900 cm , mL of MilliQ water, and dried under a nitrogen stream.
−1
normalized to the 1450 cm peak intensity, and averaged. The samples were immediately imaged under a JPK
−1
To depict the contribution in the secondary structure of Nanowizard III AFM microscope (Bruker, USA), mounted
each peptide combination, amide I peak decomposition on an inverted Olympus IX-81 optical microscope
was performed. Briefly, a Voigt function was fitted to (Olympus, Japan). The cantilevers (AC-240TS-R3, Oxford
several peaks identified in the region 1500–1800 cm , Instruments, UK) with a nominal oscillation frequency
−1
−1
which include 1550 and 1610 cm for aromatic amino of 7 kHz and spring constant of 2 N/m were calibrated by
acids; 1635 cm for water; 1650–1658 cm for α-helix; the contact-free thermal noise method. The images were
−1
−1
1661–1666 cm for β-turns; and 1680–1690 cm for acquired in tapping mode by damping the free oscillation
−1
−1
unordered secondary structures. amplitude (30 nm) of about 10% of its value. Several
2 × 2 µm images were acquired to retrieve a statistically
2.6. Scanning electron microscopy significant number of fibers. The height distribution of
Scanning electron microscopy (SEM) was performed on the sample was retrieved after subtracting a polynomial
the hydrogel formulations to elucidate their respective 3D surface of grade 5 from the image. The periodicity of the
Volume 10 Issue 5 (2024) 343 doi: 10.36922/ijb.3033