
Page 108 - IJB-6-2
P. 108
Scaffolds produced by combining porogen leaching and emulsion templating
remained clear, then air dried and photographed. 2.11 Statistical analysis
To quantify, scaffolds were submerged in 1 mL of
0.2 M sodium hydroxide: methanol and orbitally All statistical analysis was performed in GraphPad
shaken for 15 min at 100 rpm. 150 μL was then Prism (version 7.00). Data presented as mean ±
transferred in triplicate to a 96 well plate and read at standard deviation. Compressive moduli were
an absorbance of 540 nm (Tecan infinite 200-pro). compared by one-way analysis of variance
The concentration of DR80 was determined from (ANOVA) with Tukey’s post-test. Cell culture results
a standard curve. were compared by two-way ANOVA with Tukey’s
post-test. Mineral and collagen quantification are
2.9 Histology normalized to the “plain polyHIPE” at each time
point. The differences were considered significant
Scaffold infiltration was assessed on days 7 and 14 when P < 0.05 (*) and are indicated on the figures
by histology. Scaffolds were fixed as above before and in the legend. All cell culture experiments were
being submerged in optimal cutting temperature repeated twice in triplicate.
medium (Leica) and placed under vacuum for 1 h
then snap-frozen in liquid nitrogen. Sections were 3 Results
obtained using a cryostat (Leica CM1860 UV) at
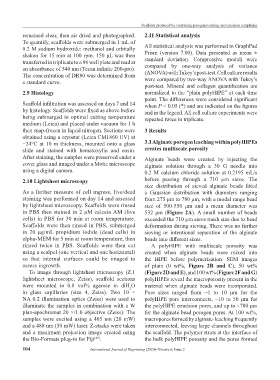
−24°C at 10 m thickness, mounted onto a glass 3.1 Alginate porogen leaching within polyHIPEs
slide and stained with hematoxylin and eosin. creates multiscale porosity
After staining, the samples were preserved under a Alginate beads were created by injecting the
cover glass and imaged under a Motic microscope alginate solution through a 30 G needle into
using a digital camera. 0.2 M calcium chloride solution at 0.2195 mL/s
2.10 Lightsheet microscopy before passing through a 710 μm sieve. The
size distribution of sieved alginate beads fitted
As a further measure of cell ingress, live/dead a Gaussian distribution with diameters ranging
staining was performed on day 14 and assessed from 275 μm to 780 μm, with a modal range bead
by lightsheet microscopy. Scaffolds were rinsed size of 500-550 μm and a mean diameter was
in PBS then stained in 2 μM calcein AM (live 532 μm (Figure 2A). A small number of beads
cells) in PBS for 30 min at room temperature. exceeded the 710 μm sieve mesh size due to bead
Scaffolds were then rinsed in PBS, submerged deformation during sieving. There was no further
in 20 μg/mL propidium iodide (dead cells) in sieving or intentional separation of the alginate
alpha-MEM for 5 min at room temperature, then beads into different sizes.
rinsed twice in PBS. Scaffolds were then cut A polyHIPE with multiscale porosity was
using a scalpel (one vertical and one horizontal) created when alginate beads were mixed into
so that internal surfaces could be imaged to the HIPE before polymerization. SEM images
assess ingrowth. of plain (0 wt%, Figure 2B and C), 50 wt%
To image through lightsheet microscopy (Z.1 (Figure 2D and E), and 100 wt% (Figure 2F and G)
lightsheet microscope, Zeiss), scaffold sections polyHIPEs reveal the macroporosity present in the
were mounted in 0.8 vol% agarose in diH O material when alginate beads were incorporated.
2
in glass capillaries (size 4, Zeiss). Two 10 × Pore sizes ranged from ~1 to 10 μm for the
NA 0.2 illumination optics (Zeiss) were used to polyHIPE pore interconnects, ~10 to 50 μm for
illuminate the samples in combination with a W the polyHIPE emulsion pores, and up to ~780 μm
plan-apochromat 20 ×/1.0 objective (Zeiss). The for the alginate bead porogen pores. At 100 wt%,
samples were excited using a 405 nm (20 mW) macropores formed by alginate-leaching frequently
and a 488 nm (50 mW) laser. Z-stacks were taken interconnected, leaving large channels throughout
and a maximum projection image created using the scaffold. The polymer struts at the interface of
the Bio-Formats plug-in for Fiji . the bulk polyHIPE porosity and the pores formed
[49]
104 International Journal of Bioprinting (2020)–Volume 6, Issue 2